T cell analysis with in-data cell sorting
load ECAUGT package
# load the ECAUGT package as well as other related packages
import ECAUGT
import sys,time,multiprocessing
import scanpy as sc
import numpy as np, pandas as pd
# set parameters
endpoint = "https://HCAd-Datasets.cn-beijing.ots.aliyuncs.com"
access_id = "LTAI5t7t216W9amUD1crMVos" #enter your id and keys
access_key = "ZJPlUbpLCij5qUPjbsU8GnQHm97IxJ"
instance_name = "HCAd-Datasets"
table_name = 'HCA_d'
# # setup client
ECAUGT.Setup_Client(endpoint, access_id, access_key, instance_name, table_name)
Connected to the server, find the table.
HCA_d
TableName: HCA_d
PrimaryKey: [('cid', 'INTEGER')]
Reserved read throughput: 0
Reserved write throughput: 0
Last increase throughput time: 1605795297
Last decrease throughput time: None
table options's time to live: -1
table options's max version: 1
table options's max_time_deviation: 86400
0
sorting cells from uGT
sort with labels
query_language = "cell_type == T cell"
cid_label = ECAUGT.query_cells(metadata_conditions=query_language, include_children=True)
51588 cells found
sort with expressional conditions
query_language  = "PTPRC>1.5 && (CD3D>1.5 || CD3E>1.5)"
gene_condition  = ECAUGT.seq2filter(query_language)
df_result_tcell = ECAUGT.get_columnsbycell_para(
                                rows_to_get = None,
                                # make sure condition associated columns listed here
                                cols_to_get=['organ','cell_type','CD3D','CD3E','PTPRC'],
                                col_filter=gene_condition,
                                do_transfer = True,
                                thread_num = 24
                         )
1093299 cells found
df_result_tcell
| CD3D | CD3E | PTPRC | cell_type | organ | |
|---|---|---|---|---|---|
| cid | |||||
| 35 | 2.910235 | 2.910235 | 3.575773 | T cell | Spleen |
| 40 | 2.403368 | 0.000000 | 3.050255 | Neutrophilic granulocyte | Spleen |
| 50 | 3.820847 | 0.000000 | 3.149373 | T cell | Spleen |
| 126 | 0.000000 | 4.292039 | 3.220413 | T cell | Spleen |
| 167 | 1.589888 | 0.000000 | 1.589888 | Plasma B cell | Spleen |
| ... | ... | ... | ... | ... | ... |
| 4085793 | 0.000000 | 3.241421 | 3.241421 | Zona fasciculata cell | Adrenal gland |
| 4089833 | 2.782014 | 0.000000 | 2.782014 | Neutrophilic granulocyte | Adrenal gland |
| 4092102 | 0.000000 | 3.204398 | 3.204398 | Neutrophilic granulocyte | Adrenal gland |
| 4092673 | 2.709732 | 0.000000 | 2.709732 | Neutrophilic granulocyte | Adrenal gland |
| 4093924 | 2.256228 | 0.000000 | 2.256228 | Zona fasciculata cell | Adrenal gland |
14710 rows × 5 columns
cid_expression = [[('cid',i)] for i in df_result_tcell.index]
merge two cid obtained from origins
# merge and remove duplicated cids
cid_list = set()
for i in range(len(cid_expression)):
    cid= cid_expression[i][0][1]
    cid_list.add(cid)

for i in range(len(cid_label)):
    cid= cid_label[i][0][1]
    cid_list.add(cid)

cid_list = list(cid_list)

# print number of obtained cids
print(len(cid_list))

# build rows_to_get variable to download data
rows_to_get = [[('cid',i)] for i in cid_list]
56540
import pickle
pickle.HIGHEST_PROTOCOL
4
with open('rows_to_get.pickle', 'wb') as f:
    pickle.dump(rows_to_get, f, protocol=4)
import pickle
with open('rows_to_get.pickle', 'rb') as f:
    rows_to_get=pickle.load(f )
from tqdm import tqdm
import pickle

# we suggest downloading cells in small batches in case of network issues
for chunk in tqdm(range(int(1+len(rows_to_get)/500)),ncols=80):
    # split batches
    lb, rb = chunk*500, (chunk+1)*500
    rows = rows_to_get[lb:rb]
    if len(rows)<=0:break

    # download rows from the unified Giant Table (uGT)
    result = ECAUGT.get_columnsbycell_para(rows_to_get = rows,
                                           cols_to_get = None, # download all columns
                                           col_filter  = None,
                                           do_transfer = True,
                                           thread_num  = 24)
    result.to_pickle("__temp_%d_%d.pk"%(lb,rb))
    #print("downloading %d~%d"%(lb, rb))
    #print(len(rows))
  5%|██▏                                      | 6/114 [09:44<2:55:11, 97.33s/it]OTS request failed, API: GetRow, HTTPStatus: 503, ErrorCode: OTSTimeout, ErrorMessage: Operation timeout., RequestID: 0005d044-f8df-f27c-613f-020a872a9e27.
100%|███████████████████████████████████████| 114/114 [3:04:25<00:00, 97.06s/it]
# load split batches
giant_table_list = []
for chunk in tqdm(range(int(1+len(rows_to_get)/500)),ncols=80):
    lb, rb = chunk*500, (chunk+1)*500
    fname = "__temp_%d_%d.pk" % (lb, rb)
    with open(fname,'rb') as f:
        df=pickle.load(f)
        giant_table_list.append(df)
100%|█████████████████████████████████████████| 114/114 [00:17<00:00, 6.59it/s]
giant_table= giant_table_list[0]

for i in range(1, len(giant_table_list)):
    giant_table = pd.concat([ giant_table, giant_table_list[i] ])
# remove intermediate results
del giant_table_list
import gc
gc.collect()


giant_table.to_pickle("sorted_tcells_raw.pk")
genes    = giant_table.columns[:43878]
metaCols = giant_table.columns[43878:43878+18]
expr = giant_table.loc[:,genes]
meta = giant_table.loc[:,metaCols]

meta.reset_index(inplace=True)
expr.reset_index(inplace=True)
expr=expr.drop(['cid'], axis=1)

print(expr.shape)
print(meta.shape)
(56540, 43878)
(56540, 19)
# check the sample-by-gene expression matrix
expr
| A12M1 | A12M2 | A12M3 | A12M4 | A1BG | A1BG-AS1 | A1CF | A2M | A2M-AS1 | A2ML1 | ... | ZXDA | ZXDB | ZXDC | ZYG11A | ZYG11AP1 | ZYG11B | ZYX | ZYXP1 | ZZEF1 | ZZZ3 | |
|---|---|---|---|---|---|---|---|---|---|---|---|---|---|---|---|---|---|---|---|---|---|
| 0 | 0.0 | 0.0 | 0.0 | 0.0 | 0.0 | 0.0 | 0.0 | 0.0 | 0.0 | 0.000000 | ... | 0.0 | 0.000000 | 0.0 | 0.0 | 0.0 | 0.0 | 0.0 | 0.0 | 0.000000 | 0.0 |
| 1 | 0.0 | 0.0 | 0.0 | 0.0 | 0.0 | 0.0 | 0.0 | 0.0 | 0.0 | 0.000000 | ... | 0.0 | 0.000000 | 0.0 | 0.0 | 0.0 | 0.0 | 0.0 | 0.0 | 0.000000 | 0.0 |
| 2 | 0.0 | 0.0 | 0.0 | 0.0 | 0.0 | 0.0 | 0.0 | 0.0 | 0.0 | 0.000000 | ... | 0.0 | 0.000000 | 0.0 | 0.0 | 0.0 | 0.0 | 0.0 | 0.0 | 0.000000 | 0.0 |
| 3 | 0.0 | 0.0 | 0.0 | 0.0 | 0.0 | 0.0 | 0.0 | 0.0 | 0.0 | 0.000000 | ... | 0.0 | 0.000000 | 0.0 | 0.0 | 0.0 | 0.0 | 0.0 | 0.0 | 0.000000 | 0.0 |
| 4 | 0.0 | 0.0 | 0.0 | 0.0 | 0.0 | 0.0 | 0.0 | 0.0 | 0.0 | 0.000000 | ... | 0.0 | 0.000000 | 0.0 | 0.0 | 0.0 | 0.0 | 0.0 | 0.0 | 0.000000 | 0.0 |
| ... | ... | ... | ... | ... | ... | ... | ... | ... | ... | ... | ... | ... | ... | ... | ... | ... | ... | ... | ... | ... | ... |
| 56535 | 0.0 | 0.0 | 0.0 | 0.0 | 0.0 | 0.0 | 0.0 | 0.0 | 0.0 | 0.000000 | ... | 0.0 | 0.000000 | 0.0 | 0.0 | 0.0 | 0.0 | 0.0 | 0.0 | 0.000000 | 0.0 |
| 56536 | 0.0 | 0.0 | 0.0 | 0.0 | 0.0 | 0.0 | 0.0 | 0.0 | 0.0 | 0.000000 | ... | 0.0 | 0.000000 | 0.0 | 0.0 | 0.0 | 0.0 | 0.0 | 0.0 | 2.165166 | 0.0 |
| 56537 | 0.0 | 0.0 | 0.0 | 0.0 | 0.0 | 0.0 | 0.0 | 0.0 | 0.0 | 0.000000 | ... | 0.0 | 2.696737 | 0.0 | 0.0 | 0.0 | 0.0 | 0.0 | 0.0 | 0.000000 | 0.0 |
| 56538 | 0.0 | 0.0 | 0.0 | 0.0 | 0.0 | 0.0 | 0.0 | 0.0 | 0.0 | 0.000000 | ... | 0.0 | 0.000000 | 0.0 | 0.0 | 0.0 | 0.0 | 0.0 | 0.0 | 0.000000 | 0.0 |
| 56539 | 0.0 | 0.0 | 0.0 | 0.0 | 0.0 | 0.0 | 0.0 | 0.0 | 0.0 | 2.658875 | ... | 0.0 | 0.000000 | 0.0 | 0.0 | 0.0 | 0.0 | 0.0 | 0.0 | 0.000000 | 0.0 |
56540 rows × 43878 columns
# check the metadata matrix
meta
| cid | cell_id | cell_type | cl_name | donor_age | donor_gender | donor_id | hcad_name | marker_gene | organ | original_name | region | sample_status | seq_tech | study_id | subregion | tissue_type | uHAF_name | user_id | |
|---|---|---|---|---|---|---|---|---|---|---|---|---|---|---|---|---|---|---|---|
| 0 | 2016314 | ACTGATGCAGCGTTCG-1-HCATisStab7587208 | T cell | T cell | NA | NA | 356C | Lung-Connective tissue-T cell-CD3D IL32 | CD3D IL32 | Lung | T_CD4 | Left lung | Healthy | 10X | 10.1186/s13059-019-1906-x | Inferior lobular | Connective tissue | Lung-Connective tissue-T cell-CD3D IL32 | 2 |
| 1 | 3100139 | FetalMaleGonad_2.TCACTTGGACATGAGATC | NK T cell | NA | GW11 | Male | Donor9 | Testis-Connective tissue-NK T cell-MT-ATP6 MT-CYB | MT-ATP6 MT-CYB | Testis | Fetal fibroblast | NA | Healthy | Microwell-seq | 10.1038/s41586-020-2157-4 | NA | Muscle tissue | Testis-Connective tissue-NK T cell-MT-ATP6 MT-CYB | 3 |
| 2 | 4063239 | AdultGallbladder_2.ACAATAAATAAAGGGCGA3 | T cell | T cell | 58yr | Male | AdultGallbladder2 | Gallbladder-Connective tissue-T cell-IL32 | IL32 | Gallbladder | T cell_CCL5 high | NA | Healthy | Microwell-seq | 10.1038/s41586-020-2157-4 | NA | Connective tissue | Gallbladder-Connective tissue-T cell-IL32 | 4 |
| 3 | 3100141 | FetalMaleGonad_2.TGATCAGTCCCGAGATGG | NK T cell | NA | GW11 | Male | Donor9 | Testis-Connective tissue-NK T cell-MT-ATP6 MT-CYB | MT-ATP6 MT-CYB | Testis | Fetal fibroblast | NA | Healthy | Microwell-seq | 10.1038/s41586-020-2157-4 | NA | Muscle tissue | Testis-Connective tissue-NK T cell-MT-ATP6 MT-CYB | 3 |
| 4 | 4063252 | AdultGallbladder_2.ACAATACATGATCGCACC3 | Epithelial cell | epithelial cell | 58yr | Male | AdultGallbladder2 | Gallbladder-Epithelial tissue-Epithelial cell-... | TM4SF4 | Gallbladder | Mucous epithelial cell | NA | Healthy | Microwell-seq | 10.1038/s41586-020-2157-4 | NA | Epithelial tissue | Gallbladder-Epithelial tissue-Epithelial cell-... | 4 |
| ... | ... | ... | ... | ... | ... | ... | ... | ... | ... | ... | ... | ... | ... | ... | ... | ... | ... | ... | ... |
| 56535 | 4063198 | AdultGallbladder_2.AATAAAAGCGAGAGGGTC3 | T cell | T cell | 58yr | Male | AdultGallbladder2 | Gallbladder-Connective tissue-T cell-IL32 | IL32 | Gallbladder | T cell | NA | Healthy | Microwell-seq | 10.1038/s41586-020-2157-4 | NA | Connective tissue | Gallbladder-Connective tissue-T cell-IL32 | 4 |
| 56536 | 1172316 | FetalMuscle_1.CAACAACCGCTAGGCTGC | Proliferating T cell | NA | GW12 | Male | NA | Muscle-Connective tissue-Proliferating T cell-... | UBE2C | Muscle | Proliferating cell_UBE2C high | NA | Healthy | Microwell-seq | 10.1038/s41586-020-2157-4 | NA | Connective tissue | Muscle-Connective tissue-Proliferating T cell-... | 1 |
| 56537 | 3100133 | FetalMaleGonad_2.TAGCATAACCTACAAAGT | NK T cell | NA | GW11 | Male | Donor9 | Testis-Connective tissue-NK T cell-MT-ATP6 MT-CYB | MT-ATP6 MT-CYB | Testis | Fetal fibroblast | NA | Healthy | Microwell-seq | 10.1038/s41586-020-2157-4 | NA | Muscle tissue | Testis-Connective tissue-NK T cell-MT-ATP6 MT-CYB | 3 |
| 56538 | 3100135 | FetalMaleGonad_2.TTTAGGGTGGTACCATCT | NK T cell | NA | GW11 | Male | Donor9 | Testis-Connective tissue-NK T cell-MT-ATP6 MT-CYB | MT-ATP6 MT-CYB | Testis | Fetal fibroblast | NA | Healthy | Microwell-seq | 10.1038/s41586-020-2157-4 | NA | Muscle tissue | Testis-Connective tissue-NK T cell-MT-ATP6 MT-CYB | 3 |
| 56539 | 3100136 | FetalMaleGonad_2.CCATCTGCGTCCTGTGCG | NK T cell | NA | GW11 | Male | Donor9 | Testis-Connective tissue-NK T cell-MT-ATP6 MT-CYB | MT-ATP6 MT-CYB | Testis | Fetal fibroblast | NA | Healthy | Microwell-seq | 10.1038/s41586-020-2157-4 | NA | Muscle tissue | Testis-Connective tissue-NK T cell-MT-ATP6 MT-CYB | 3 |
56540 rows × 19 columns
create single-cell analysis objects
# create scanpy object from the matrices
adata = sc.AnnData(X = expr, obs = meta)
adata.var_names_make_unique()

sc.pp.filter_genes(adata, min_counts=5)
sc.pp.filter_genes(adata, min_cells=3)
# post-processing steps
from scipy.sparse import csc_matrix
adata.X = csc_matrix(adata.X, dtype=np.float32)

adata.obs['donor_id']=adata.obs['donor_id'].astype(str)
adata.write_h5ad("sorted_tcells_raw.h5ad")
/home/chensijie/software/anaconda3/envs/r411py37/lib/python3.7/site-packages/anndata/_core/anndata.py:1220: FutureWarning: The inplace parameter in pandas.Categorical.reorder_categories is deprecated and will be removed in a future version. Removing unused categories will always return a new Categorical object.
  c.reorder_categories(natsorted(c.categories), inplace=True)
... storing 'donor_id' as categorical
filter cells for downstream analysis
# remove fibroblast
sel = adata[:,"LUM"].X==0
adata = adata[sel].copy()

sel = adata[:,"SERPING1"].X==0
adata = adata[sel].copy()

sel = adata[:,"COL1A1"].X==0
adata = adata[sel].copy()

sel = adata[:,"COL1A2"].X==0
adata = adata[sel].copy()

# remove vascular endothelial cells
sel = adata[:,"INMT"].X==0
adata = adata[sel].copy()

# remove muscle cells
sel = adata[:,"ACTA2"].X==0
adata = adata[sel].copy()

# remove granulocytes
sel = adata[:,"S100A8"].X==0
adata = adata[sel].copy()

sel = adata[:,"S100A9"].X==0
adata = adata[sel].copy()

sel = adata[:,"SIGLEC8"].X==0
adata = adata[sel].copy()


# remove myeloid cells
sel = adata[:,"C1QA"].X==0
adata = adata[sel].copy()

sel = adata[:,"C1QB"].X==0
adata = adata[sel].copy()

sel = adata[:,"C1QC"].X==0
adata = adata[sel].copy()

sel = adata[:,"ITGAM"].X==0
adata = adata[sel].copy()

sel = adata[:,"ITGAX"].X==0
adata = adata[sel].copy()

# remove B cells
sel = adata[:,"CD79A"].X==0
adata = adata[sel].copy()

sel = adata[:,"CD79B"].X==0
adata = adata[sel].copy()

sel = adata[:,"CD19"].X==0
adata = adata[sel].copy()

sel = adata[:,"MS4A1"].X==0
adata = adata[sel].copy()

# remove cells from nerve tissues
sel = adata[:,"FSCN1"].X==0
adata = adata[sel].copy()
adata
AnnData object with n_obs × n_vars = 20553 × 20491
    obs: 'cid', 'cell_id', 'cell_type', 'cl_name', 'donor_age', 'donor_gender', 'donor_id', 'hcad_name', 'marker_gene', 'organ', 'original_name', 'region', 'sample_status', 'seq_tech', 'study_id', 'subregion', 'tissue_type', 'uHAF_name', 'user_id'
    var: 'n_counts', 'n_cells'
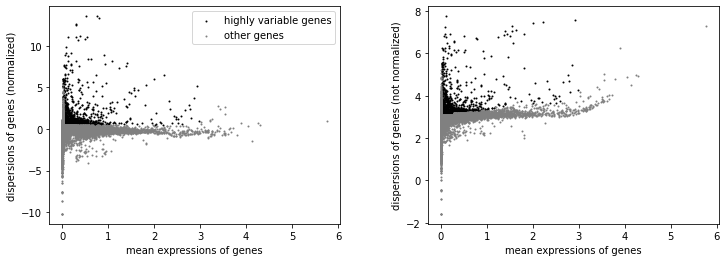
sc.pp.highly_variable_genes(adata, min_mean=0.0125, max_mean=3, min_disp=0.5)
sc.pl.highly_variable_genes(adata)
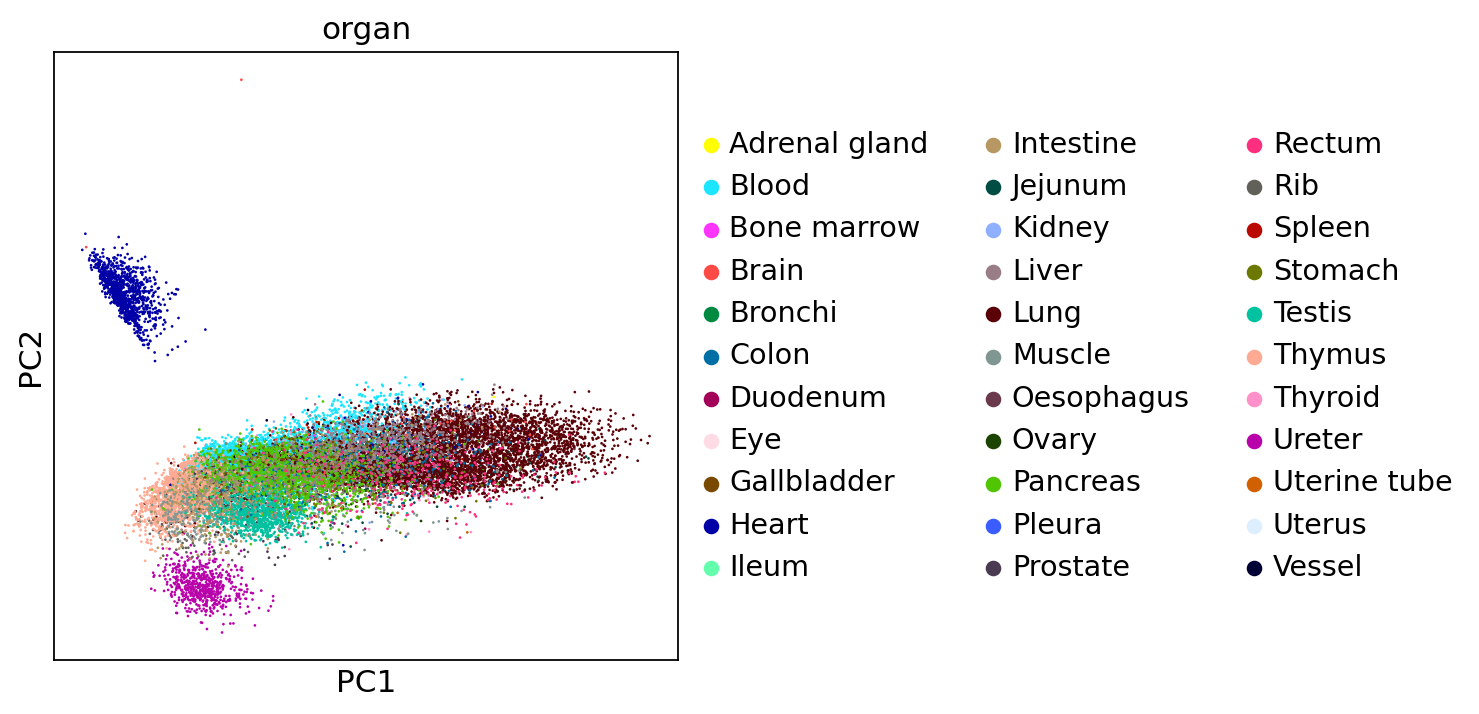
sc.tl.pca(adata, svd_solver='arpack')
sc.set_figure_params(figsize=[5,5])
sc.pl.pca(adata,color="organ")
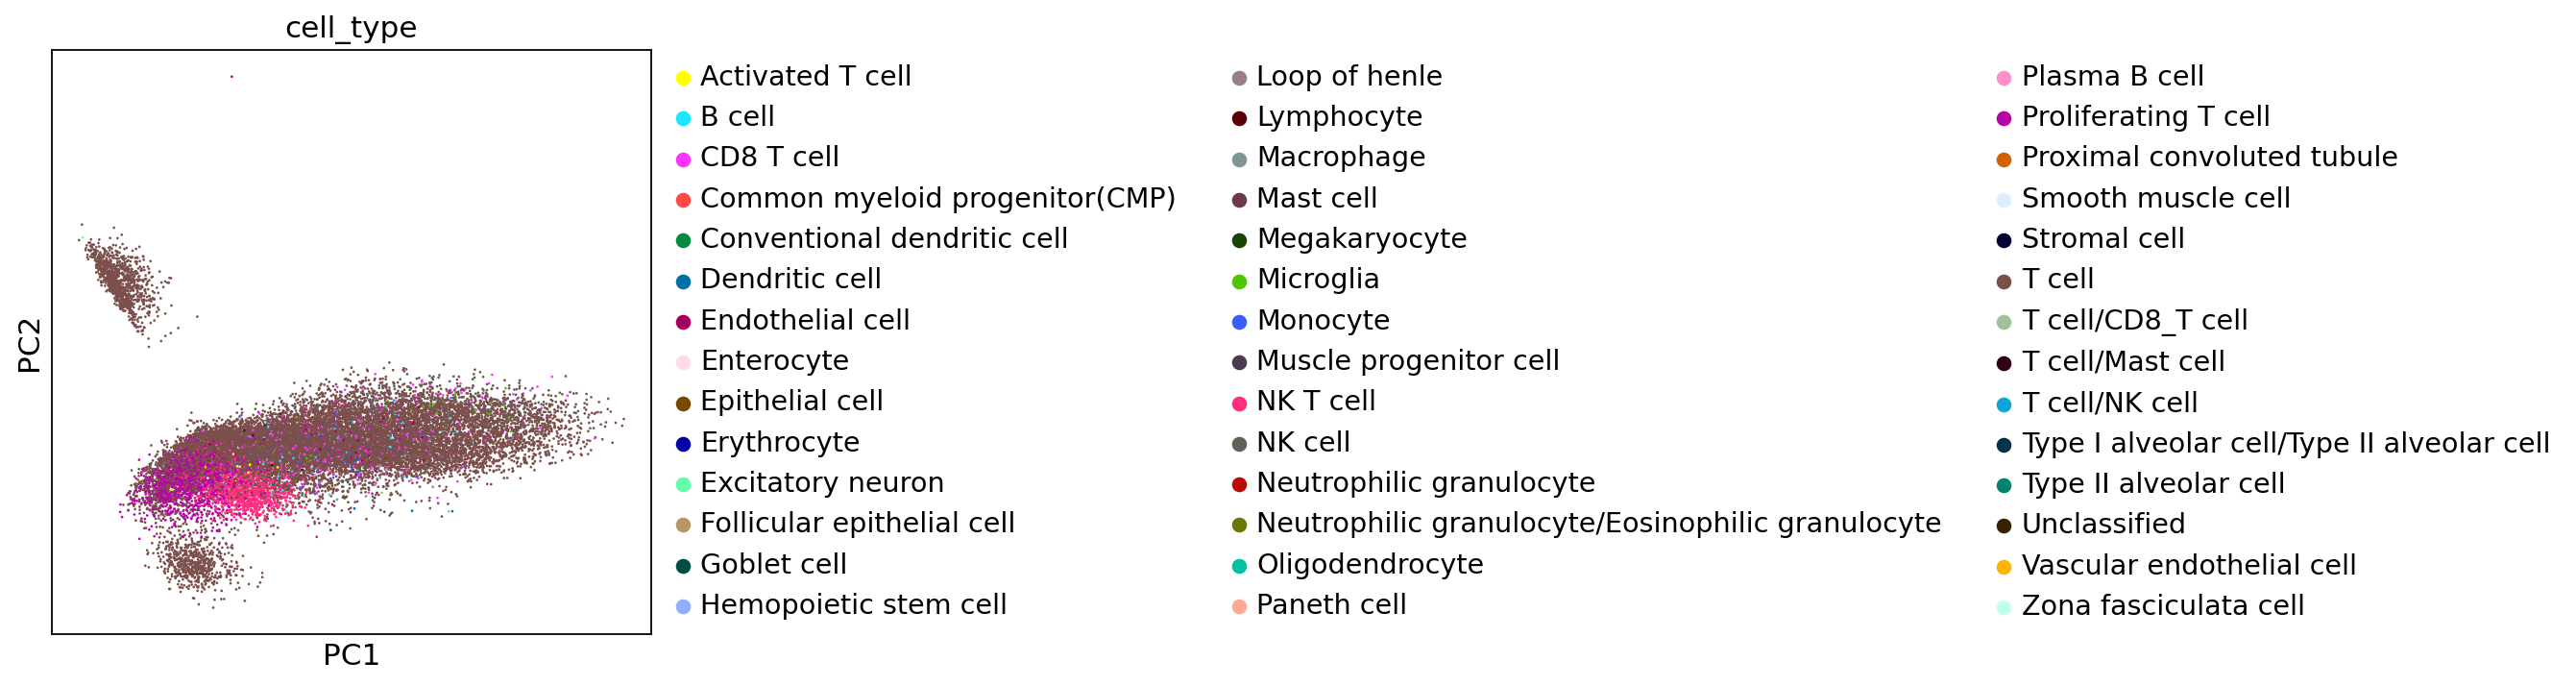
sc.set_figure_params(figsize=[5,5])
sc.pl.pca(adata,color="cell_type")
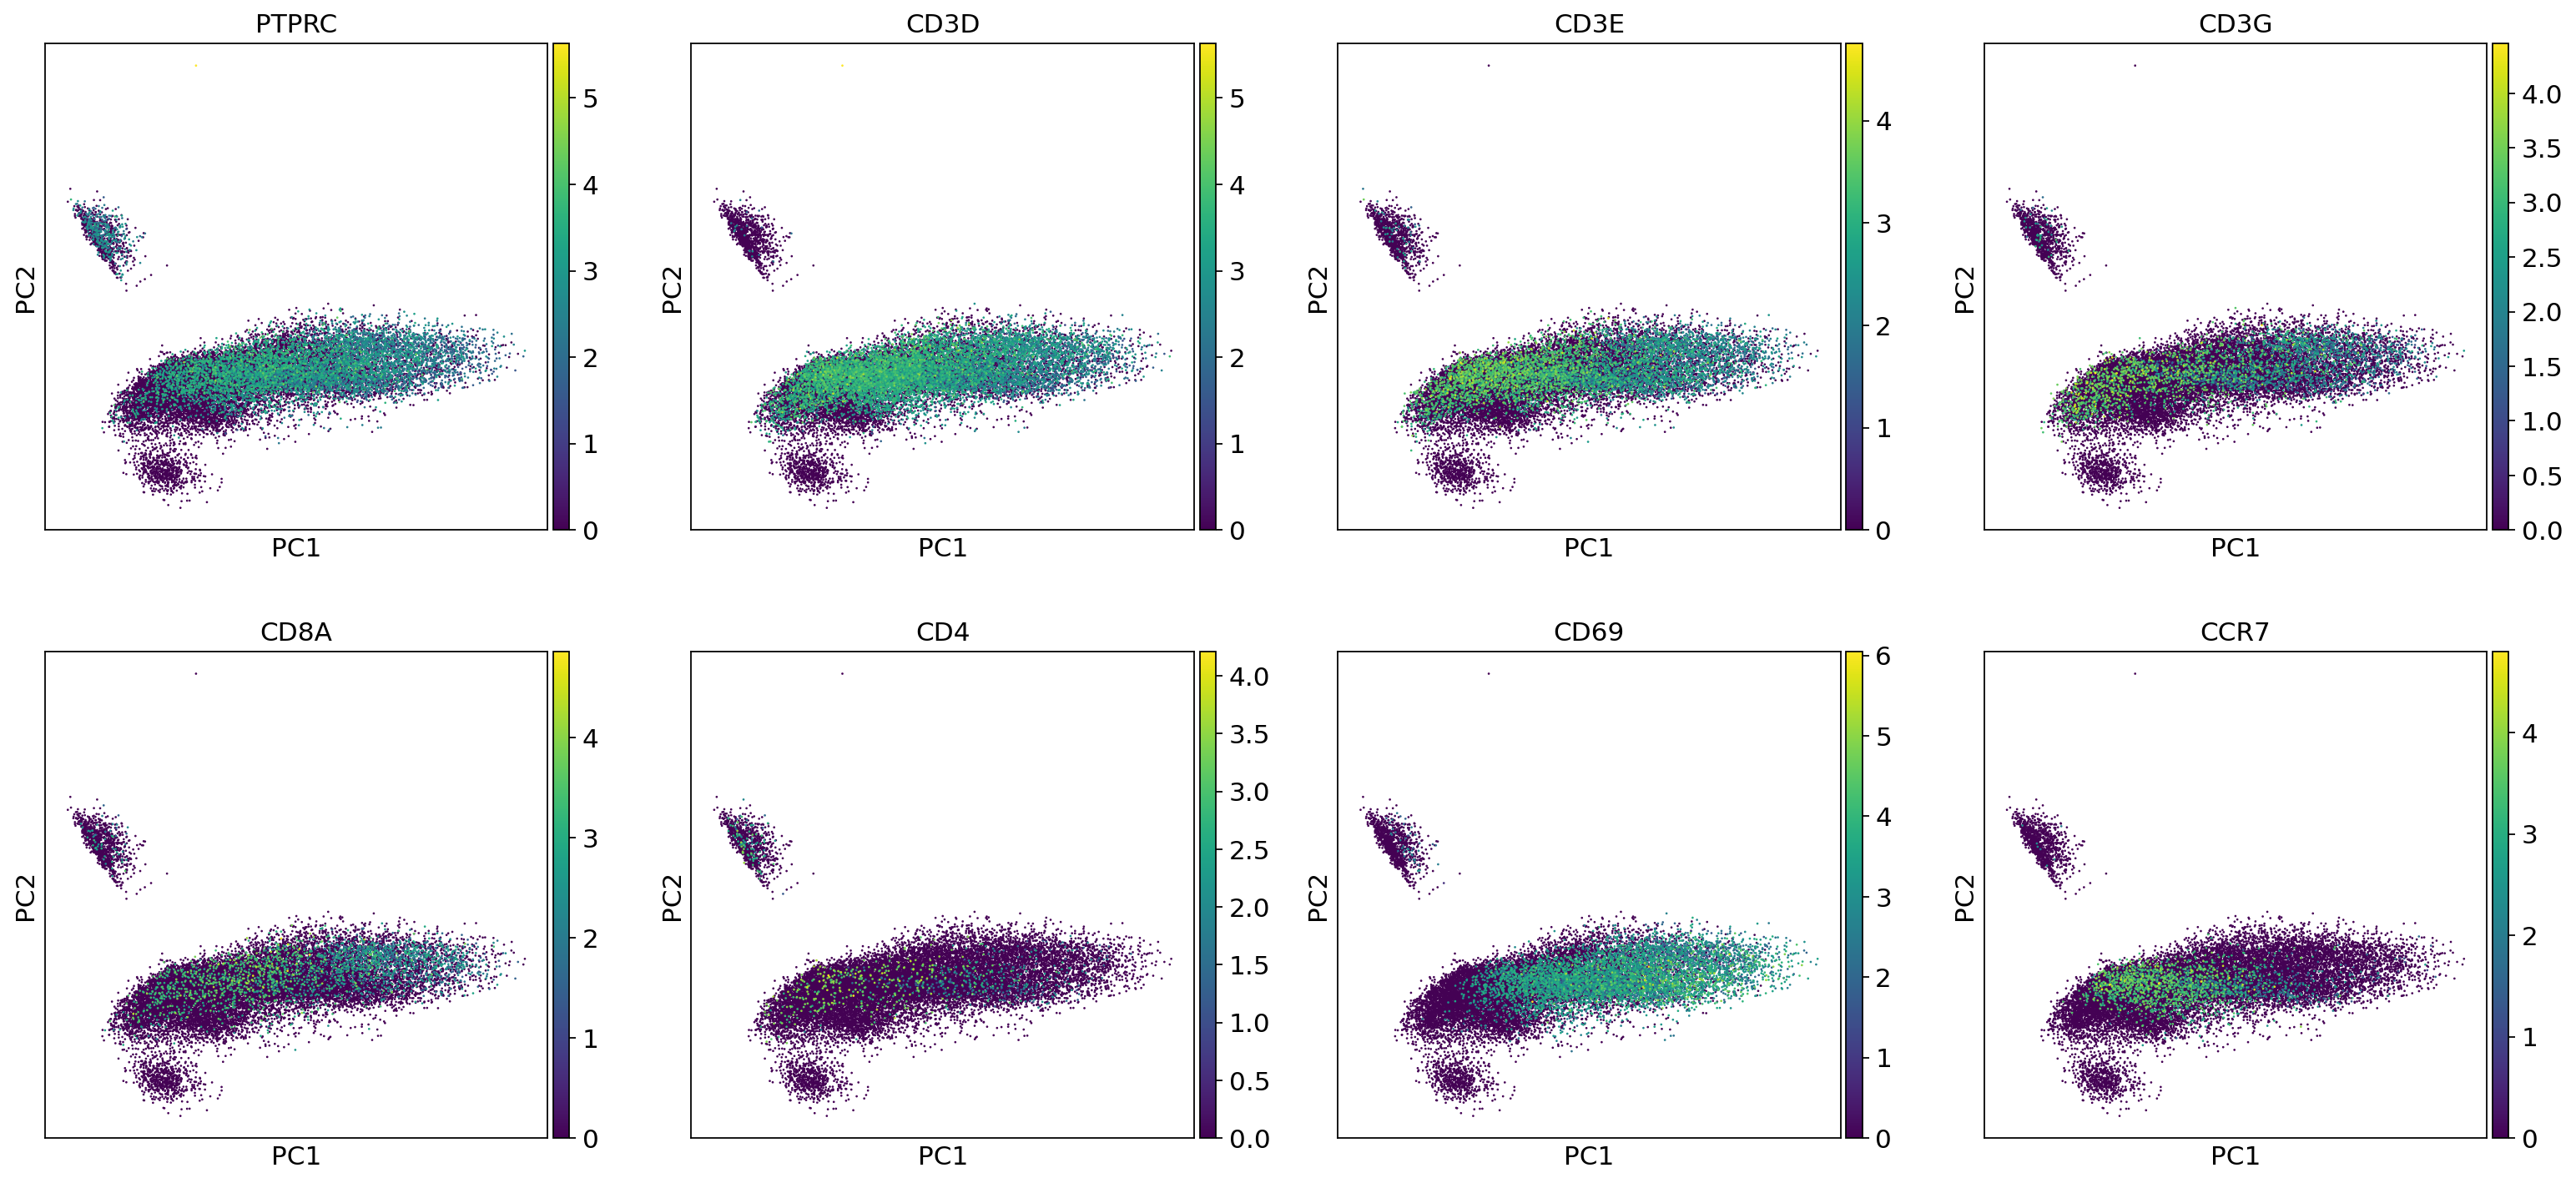
sc.set_figure_params(figsize=[5,5])
sc.pl.pca(adata,color=["PTPRC","CD3D","CD3E","CD3G",
                       "CD8A","CD4","CD69","CCR7"],sort_order=True)
adata.write_h5ad("sorted_tcells_filtered.h5ad")
Now we have obtained a collection of T cell using in data sorting. You can do what ever analysis you like with these sorted cells.
We have done some downstream metabolic pathway analysis on these cells using GSVA, which is available at https://github.com/XuegongLab/hECA/tree/main/examples