ECAUGT CD19
import packages and setup
import sys
import pandas as pd
import ECAUGT
import time
import multiprocessing
import numpy as np
# set parameters
endpoint = "https://HCAd-Datasets.cn-beijing.ots.aliyuncs.com"
access_id = "LTAI5t7t216W9amUD1crMVos" #enter your id and keys
access_key = "ZJPlUbpLCij5qUPjbsU8GnQHm97IxJ"
instance_name = "HCAd-Datasets"
table_name = 'HCA_d'
# # setup client
ECAUGT.Setup_Client(endpoint, access_id, access_key, instance_name, table_name)
Connected to the server, find the table.
HCA_d
TableName: HCA_d
PrimaryKey: [('cid', 'INTEGER')]
Reserved read throughput: 0
Reserved write throughput: 0
Last increase throughput time: 1605795297
Last decrease throughput time: None
table options's time to live: -1
table options's max version: 1
table options's max_time_deviation: 86400
0
Get data
filter by gene expression
gene_condition = ECAUGT.seq2filter("CD19 > 0.1")
df_result_cd19 = ECAUGT.get_columnsbycell_para(rows_to_get = None, cols_to_get=['CD19', 'organ', 'cell_type'],
                                          col_filter=gene_condition, do_transfer = True,
                                          thread_num = multiprocessing.cpu_count()-1)
1093299 cells found
filter by gene expression in web server
Open hECA website and set filters to get CD19+ cells
this step takes about 5 minutes
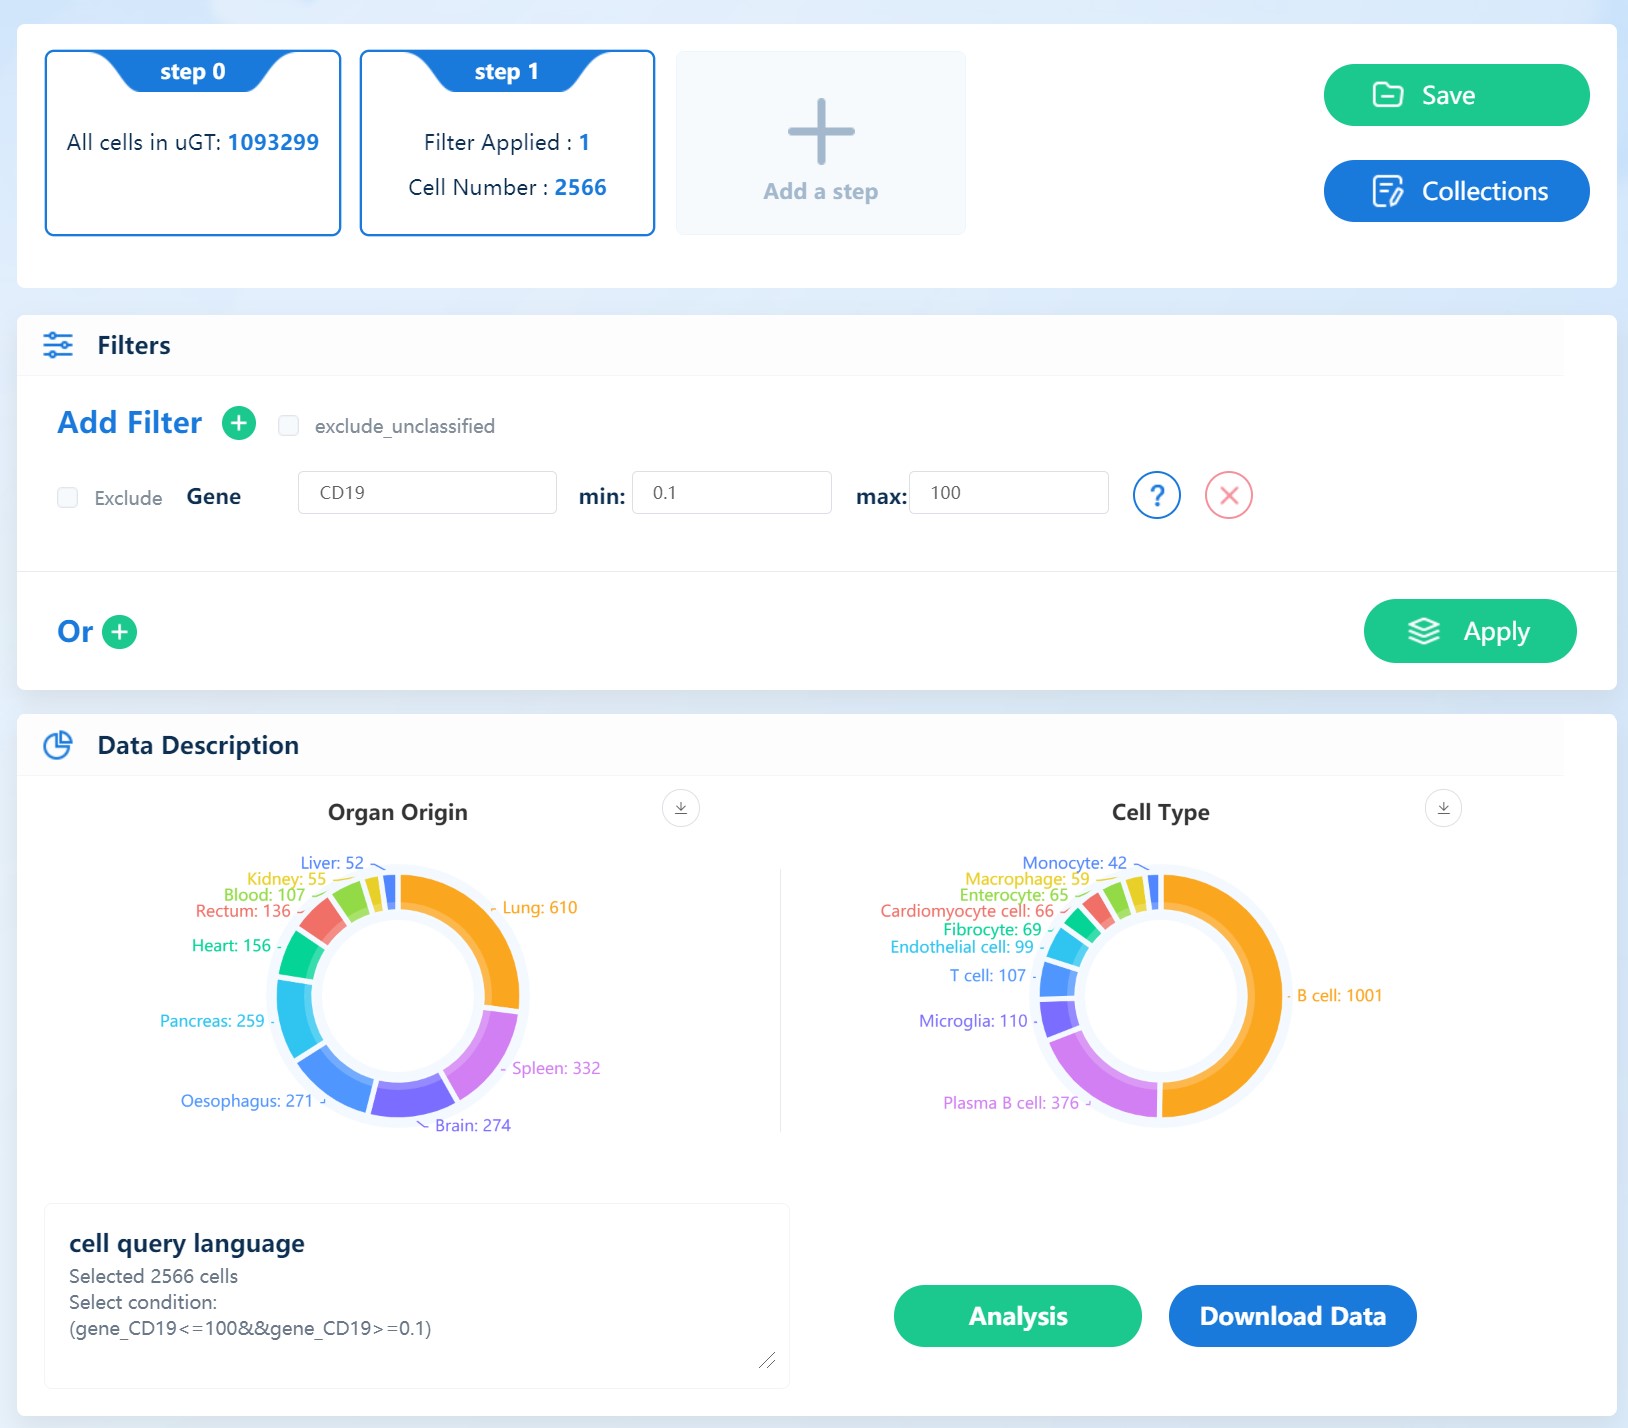
img
click “Download Data” and a file containing ids of selected cells is downloaded
Get gene expression data and metadata
this step takes about 10 minutes on a server with 24 cpu cores
# if use web to query, load cid list like this
# rows_to_get = pd.read_csv('./cellSelectionRawData_1625643023446.txt')
# rows_to_get = [[('cid',i)] for i in rows_to_get['cid']]

rows_to_get = rows_to_get = [[('cid',i)] for i in df_result_cd19.index]
result = ECAUGT.get_columnsbycell_para(rows_to_get = rows_to_get, cols_to_get=None,
                                       col_filter=gene_condition, do_transfer = True,
                                       thread_num = multiprocessing.cpu_count()-1)
genes = result.columns[:43878]
metaCols = result.columns[43878:43878+18]
expr = result.loc[:,genes]
meta = result.loc[:,metaCols]
print(expr.shape)
print(meta.shape)
(2566, 43878)
(2566, 18)
meta.columns
Index(['cell_id', 'cell_type', 'cl_name', 'donor_age', 'donor_gender',
       'donor_id', 'hcad_name', 'marker_gene', 'organ', 'original_name',
       'region', 'sample_status', 'seq_tech', 'study_id', 'subregion',
       'tissue_type', 'uHAF_name', 'user_id'],
      dtype='object')
Analyze CD19+ data with scanpy
import scanpy as sc
sc.settings.verbosity = 3             # verbosity: errors (0), warnings (1), info (2), hints (3)
sc.logging.print_versions()
sc.settings.set_figure_params(dpi=80)
scanpy==1.4.4.post1 anndata==0.6.22.post1 umap==0.3.10 numpy==1.17.3 scipy==1.3.2 pandas==0.25.3 scikit-learn==0.21.3 statsmodels==0.10.2 python-igraph==0.7.1 louvain==0.6.1
adata = sc.AnnData(X = expr, obs = meta)
Transforming to str index.
adata.var_names_make_unique()
adata
AnnData object with n_obs × n_vars = 2566 × 43878
    obs: 'cell_id', 'cell_type', 'cl_name', 'donor_age', 'donor_gender', 'donor_id', 'hcad_name', 'marker_gene', 'organ', 'original_name', 'region', 'sample_status', 'seq_tech', 'study_id', 'subregion', 'tissue_type', 'uHAF_name', 'user_id'
adata = adata[:, np.sum(np.isnan(adata.X), axis = 0)==0]
adata
View of AnnData object with n_obs × n_vars = 2566 × 43871
    obs: 'cell_id', 'cell_type', 'cl_name', 'donor_age', 'donor_gender', 'donor_id', 'hcad_name', 'marker_gene', 'organ', 'original_name', 'region', 'sample_status', 'seq_tech', 'study_id', 'subregion', 'tissue_type', 'uHAF_name', 'user_id'
sc.pp.normalize_total(adata, target_sum=1e4)
Normalizing counts per cell.
    finished (0:00:00):normalized adata.X
sc.pp.log1p(adata)
/home/ghx/anaconda3/envs/Seurat/lib/python3.7/site-packages/scanpy/preprocessing/_simple.py:285: UserWarning: Revieved a view of an AnnData. Making a copy.
  view_to_actual(data)
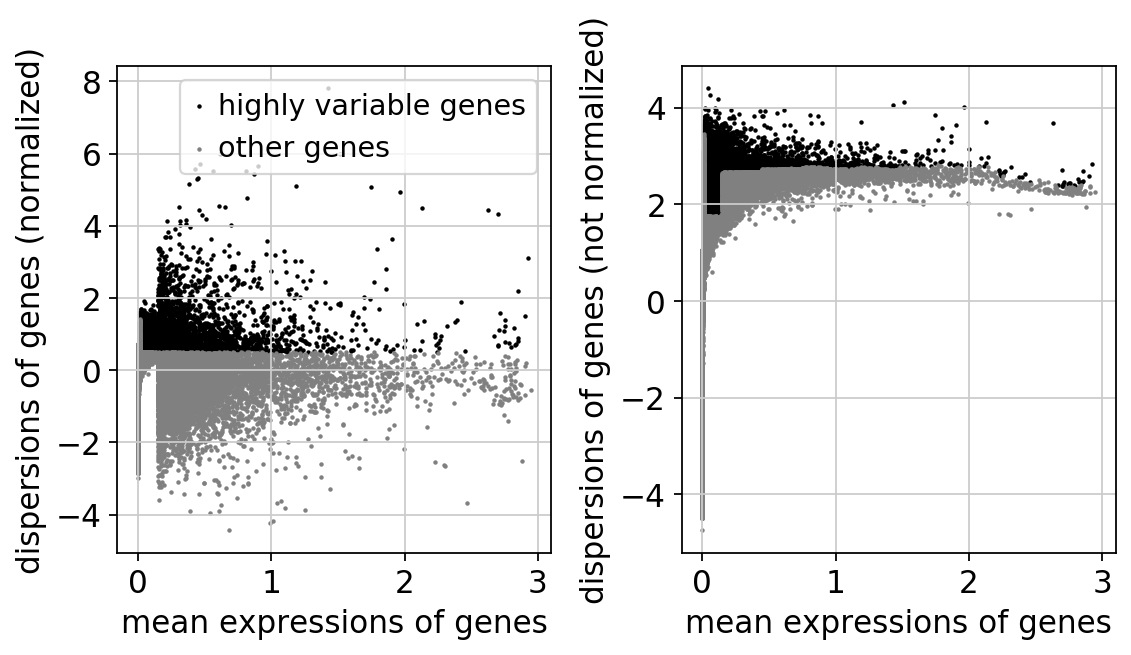
sc.pp.highly_variable_genes(adata, min_mean=0.0125, max_mean=3, min_disp=0.5)
sc.pl.highly_variable_genes(adata)
extracting highly variable genes
    finished (0:00:02)
--> added
    'highly_variable', boolean vector (adata.var)
    'means', float vector (adata.var)
    'dispersions', float vector (adata.var)
    'dispersions_norm', float vector (adata.var)
adata.raw = adata
adata = adata[:, adata.var.highly_variable]
sc.pp.scale(adata, max_value=10)
sc.tl.pca(adata, svd_solver='arpack')
sc.pp.neighbors(adata, n_neighbors=10, n_pcs=40)
/home/ghx/anaconda3/envs/Seurat/lib/python3.7/site-packages/scanpy/preprocessing/_simple.py:869: UserWarning: Revieved a view of an AnnData. Making a copy.
  view_to_actual(adata)
computing PCA with n_comps = 50
computing PCA on highly variable genes
    finished (0:00:00)
computing neighbors
    using 'X_pca' with n_pcs = 40
    finished: added to .uns['neighbors']
    'distances', distances for each pair of neighbors
    'connectivities', weighted adjacency matrix (0:00:01)
sc.tl.umap(adata)
computing UMAP
/home/ghx/anaconda3/envs/Seurat/lib/python3.7/site-packages/umap/spectral.py:229: UserWarning: Embedding a total of 3 separate connected components using meta-embedding (experimental)
  n_components
finished: added
'X_umap', UMAP coordinates (adata.obsm) (0:00:06)
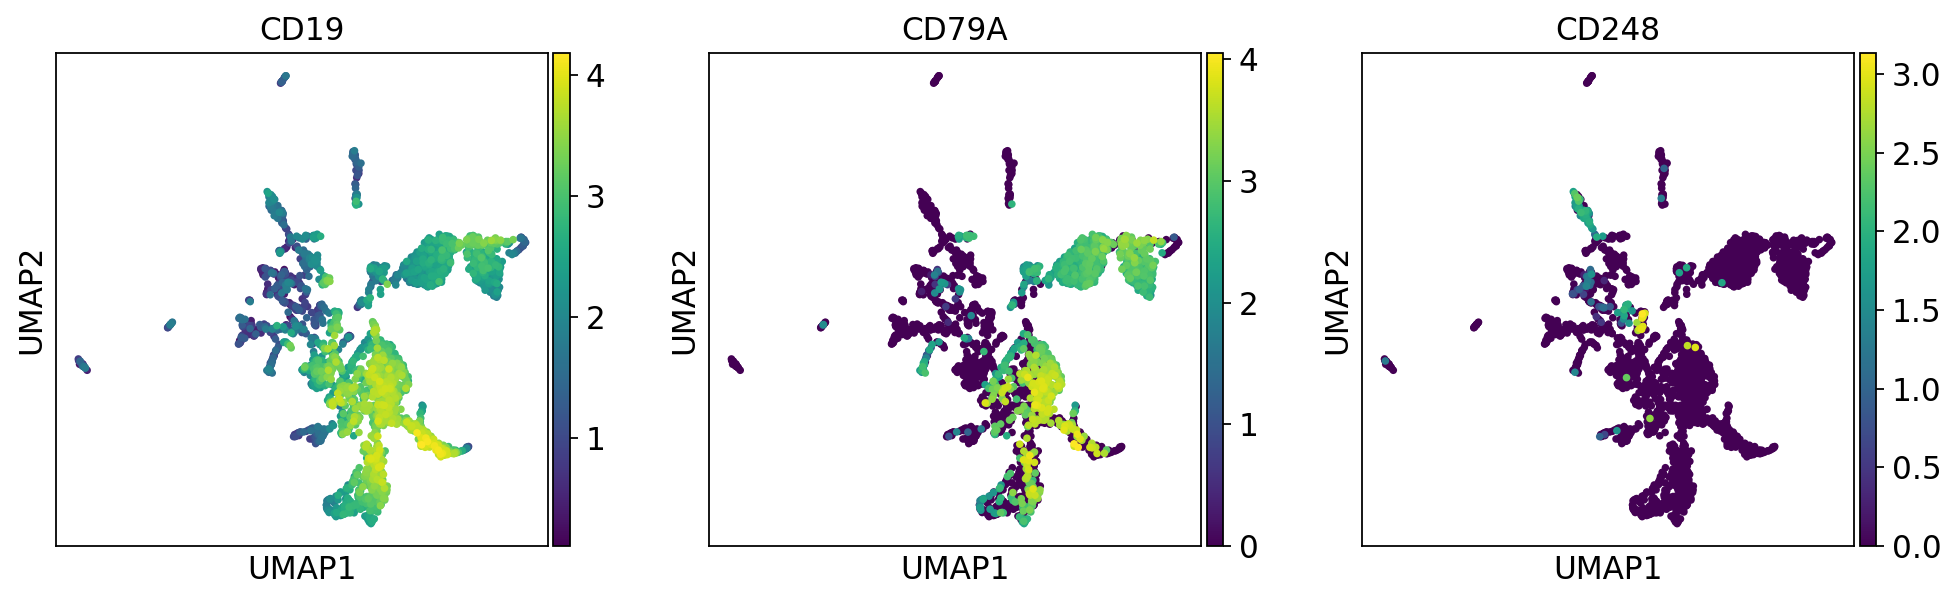
sc.pl.umap(adata, color=['CD19', 'CD79A', 'CD248'])
... storing 'cell_type' as categorical
... storing 'cl_name' as categorical
... storing 'donor_age' as categorical
... storing 'donor_gender' as categorical
... storing 'donor_id' as categorical
... storing 'hcad_name' as categorical
... storing 'marker_gene' as categorical
... storing 'organ' as categorical
... storing 'original_name' as categorical
... storing 'region' as categorical
... storing 'sample_status' as categorical
... storing 'seq_tech' as categorical
... storing 'study_id' as categorical
... storing 'subregion' as categorical
... storing 'tissue_type' as categorical
... storing 'uHAF_name' as categorical
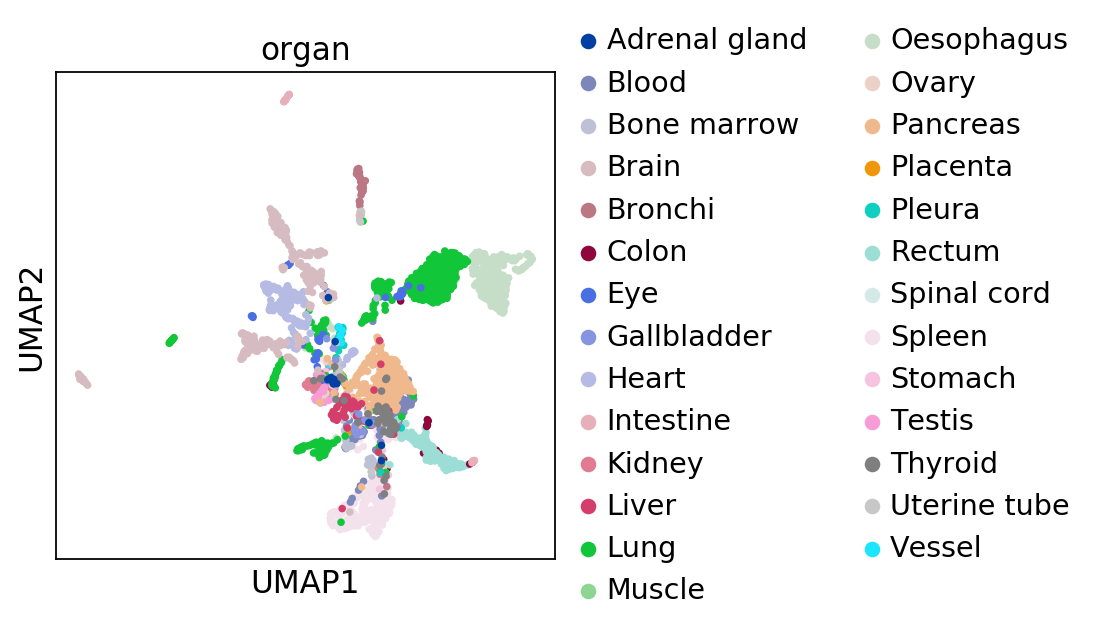
sc.pl.umap(adata, color=['organ'])

sc.pl.umap(adata, color=['cell_type'])
tb = pd.crosstab(index=meta['organ'], columns=meta['cell_type'])
tb.iloc[np.where(tb.sum(axis = 1)>30)[0], np.where(tb.sum(axis = 0)>30)[0]]
| cell_type | B cell | Cardiomyocyte cell | Dendritic cell | Endothelial cell | Enterocyte | Excitatory neuron | Fibrocyte | Macrophage | Microglia | Monocyte | NK cell | Plasma B cell | T cell | Unclassified |
|---|---|---|---|---|---|---|---|---|---|---|---|---|---|---|
| organ | ||||||||||||||
| Blood | 0 | 0 | 0 | 0 | 0 | 0 | 0 | 1 | 0 | 12 | 0 | 26 | 38 | 2 |
| Bone marrow | 0 | 0 | 0 | 0 | 0 | 0 | 0 | 1 | 0 | 1 | 0 | 18 | 1 | 0 |
| Brain | 0 | 0 | 0 | 62 | 0 | 36 | 0 | 0 | 108 | 0 | 0 | 0 | 0 | 20 |
| Bronchi | 1 | 0 | 0 | 0 | 0 | 0 | 1 | 0 | 0 | 0 | 0 | 0 | 0 | 9 |
| Eye | 12 | 0 | 0 | 1 | 0 | 0 | 0 | 0 | 2 | 0 | 0 | 0 | 0 | 0 |
| Heart | 0 | 66 | 0 | 6 | 0 | 0 | 20 | 14 | 0 | 0 | 0 | 0 | 0 | 0 |
| Kidney | 2 | 0 | 2 | 1 | 0 | 0 | 0 | 0 | 0 | 0 | 0 | 0 | 0 | 2 |
| Liver | 35 | 0 | 1 | 0 | 0 | 0 | 0 | 0 | 0 | 1 | 0 | 0 | 3 | 0 |
| Lung | 469 | 0 | 9 | 1 | 0 | 0 | 25 | 25 | 0 | 20 | 20 | 4 | 5 | 0 |
| Oesophagus | 241 | 0 | 10 | 7 | 0 | 0 | 0 | 0 | 0 | 0 | 0 | 0 | 1 | 0 |
| Pancreas | 157 | 0 | 10 | 7 | 0 | 0 | 0 | 1 | 0 | 8 | 13 | 4 | 49 | 0 |
| Rectum | 64 | 0 | 0 | 0 | 55 | 0 | 0 | 0 | 0 | 0 | 0 | 7 | 6 | 1 |
| Spleen | 0 | 0 | 0 | 9 | 0 | 0 | 0 | 3 | 0 | 0 | 0 | 310 | 2 | 0 |
| Thyroid | 0 | 0 | 2 | 1 | 0 | 0 | 0 | 0 | 0 | 0 | 7 | 5 | 0 | 0 |
# expr.to_csv('./expr_CD19.csv')
# meta.to_csv('./meta_CD19.csv')