4. Covid19 data immune selection
Table of Contents
1 per-sample filtering
1.1 sample 1
1.2 sample 2
1.3 sample 3
1.4 sample 5
1.5 sample 6
1.6 sample 7
1.7 sample 8
1.8 sample 9
1.9 sample 12
1.10 sample 13
1.11 per-sample reclustering after filtering
2 integration
2.1 harmony
2.2 drop non-immune cells
2.3 reclustering after dropping
2.4 split by batch
3 per-sample annotation
3.1 HC3
3.1.1 DC
3.1.2 Mac
3.1.3 T
3.2 HC4
3.2.1 DC
3.2.2 Mac
3.2.3 T
3.3 M1
3.3.1 DC
3.3.2 Mac
3.3.3 T
3.4 M2
3.4.1 DC
3.4.2 Mac
3.4.3 T
3.5 S1
3.5.1 DC
3.5.2 T
3.5.3 Mac
3.6 S2
3.6.1 DC
3.6.2 Mac
3.6.3 T
3.7 S3
3.7.1 T
3.7.2 DC
3.7.3 Mac
3.8 S4
3.8.1 DC
3.8.2 Mac
3.8.3 T
3.9 S5
3.9.1 DC
3.9.2 Mac
3.9.3 T
3.10 S6
3.10.1 DC
3.10.2 Mac
3.10.3 T
library(tictoc)
library(Seurat)
library(Nebulosa)
tic()
load(file = 'nCoV.list.qc.rda')
toc()
92.059 sec elapsed
library(Seurat)
library(dplyr)
library(ggpubr)
o<-function(w,h) options(repr.plot.width=w, repr.plot.height=h)
Attaching package: ‘dplyr’


The following objects are masked from ‘package:stats’:

    filter, lag


The following objects are masked from ‘package:base’:

    intersect, setdiff, setequal, union


Loading required package: ggplot2
manymanycolors=c('#e6194b', '#3cb44b', '#ffe119', '#4363d8', '#f58231', '#911eb4', '#46f0f0', '#f032e6', '#bcf60c', '#fabebe', '#008080', '#e6beff', '#9a6324', '#fffac8', '#800000', '#aaffc3', '#808000', '#ffd8b1', '#000075', '#808080', '#4f34ff', '#f340F0')
per-sample filtering
sample 1
i=1
o(10,10)

DimPlot(nCoV.list[[i]], label=T,repel=T, group.by="RNA_snn_res.1.2")&NoLegend()&
    theme(axis.line = element_blank(),
          axis.title = element_blank(),
          axis.text = element_blank(),
          axis.ticks=element_blank()
         )

o(5*5, 5*3)
FeaturePlot(nCoV.list[[i]],
            features = c("PTPRC","COL1A1","EPCAM","PECAM1","CD3D",
                         'ITGAM','ITGAX',"CD68",'S100A9',"FCGR3B",
                         'CD79A','CD4','CD8A','IL7R','CCR7',
                         "CD44","IL2RA",'ITGAE','SELL','CD69'),
            ncol=5
)&theme(axis.line = element_blank(),
        axis.title = element_blank(),
        axis.text = element_blank(),
        axis.ticks=element_blank()
)


nCoV.list[[i]] <- subset(nCoV.list[[i]] , RNA_snn_res.1.2 != 15)
nCoV.list[[i]] <- subset(nCoV.list[[i]] , RNA_snn_res.1.2 != 18)
sample 2
i=2
o(10,10)

DimPlot(nCoV.list[[i]], label=T,repel=T, group.by="RNA_snn_res.1.2")&NoLegend()&
    theme(axis.line = element_blank(),
          axis.title = element_blank(),
          axis.text = element_blank(),
          axis.ticks=element_blank()
         )

o(5*5, 5*3)
FeaturePlot(nCoV.list[[i]],
            features = c("PTPRC","COL1A1","EPCAM","PECAM1","CD3D",
                         'ITGAM','ITGAX',"CD68",'S100A9',"FCGR3B",
                         'CD79A','CD4','CD8A','IL7R','CCR7',
                         "CD44","IL2RA",'ITGAE','SELL','CD69'),
            ncol=5
)&theme(axis.line = element_blank(),
        axis.title = element_blank(),
        axis.text = element_blank(),
        axis.ticks=element_blank()
)


nCoV.list[[i]] <- subset(nCoV.list[[i]] , RNA_snn_res.1.2 != 10)
sample 3
i=3
o(10,10)

DimPlot(nCoV.list[[i]], label=T,repel=T, group.by="RNA_snn_res.1.2")&NoLegend()&
    theme(axis.line = element_blank(),
          axis.title = element_blank(),
          axis.text = element_blank(),
          axis.ticks=element_blank()
         )

o(5*5, 5*3)
FeaturePlot(nCoV.list[[i]],
            features = c("PTPRC","COL1A1","EPCAM","PECAM1","CD3D",
                         'ITGAM','ITGAX',"CD68",'S100A9',"FCGR3B",
                         'CD79A','CD4','CD8A','IL7R','CCR7',
                         "CD44","IL2RA",'ITGAE','SELL','CD69'),
            ncol=5
)&theme(axis.line = element_blank(),
        axis.title = element_blank(),
        axis.text = element_blank(),
        axis.ticks=element_blank()
)


nCoV.list[[i]] <- subset(nCoV.list[[i]] , RNA_snn_res.1.2 != 17)
sample 5
i=5
o(10,10)

DimPlot(nCoV.list[[i]], label=T,repel=T, group.by="RNA_snn_res.1.2")&NoLegend()&
    theme(axis.line = element_blank(),
          axis.title = element_blank(),
          axis.text = element_blank(),
          axis.ticks=element_blank()
         )

o(5*5, 5*3)
FeaturePlot(nCoV.list[[i]],
            features = c("PTPRC","COL1A1","EPCAM","PECAM1","CD3D",
                         'ITGAM','ITGAX',"CD68",'S100A9',"FCGR3B",
                         'CD79A','CD4','CD8A','IL7R','CCR7',
                         "CD44","IL2RA",'ITGAE','SELL','CD69'),
            ncol=5
)&theme(axis.line = element_blank(),
        axis.title = element_blank(),
        axis.text = element_blank(),
        axis.ticks=element_blank()
)


nCoV.list[[i]] <- subset(nCoV.list[[i]] , RNA_snn_res.1.2 != 14)
nCoV.list[[i]] <- subset(nCoV.list[[i]] , RNA_snn_res.1.2 != 16)
nCoV.list[[i]] <- subset(nCoV.list[[i]] , RNA_snn_res.1.2 != 19)
nCoV.list[[i]] <- subset(nCoV.list[[i]] , RNA_snn_res.1.2 != 21)
sample 6
i=6
o(10,10)

DimPlot(nCoV.list[[i]], label=T,repel=T, group.by="RNA_snn_res.1.2")&NoLegend()&
    theme(axis.line = element_blank(),
          axis.title = element_blank(),
          axis.text = element_blank(),
          axis.ticks=element_blank()
         )

o(5*5, 5*3)
FeaturePlot(nCoV.list[[i]],
            features = c("PTPRC","COL1A1","EPCAM","PECAM1","CD3D",
                         'ITGAM','ITGAX',"CD68",'S100A9',"FCGR3B",
                         'CD79A','CD4','CD8A','IL7R','CCR7',
                         "CD44","IL2RA",'ITGAE','SELL','CD69'),
            ncol=5
)&theme(axis.line = element_blank(),
        axis.title = element_blank(),
        axis.text = element_blank(),
        axis.ticks=element_blank()
)


nCoV.list[[i]] <- subset(nCoV.list[[i]] , RNA_snn_res.1.2 != 4)
nCoV.list[[i]] <- subset(nCoV.list[[i]] , RNA_snn_res.1.2 != 5)
nCoV.list[[i]] <- subset(nCoV.list[[i]] , RNA_snn_res.1.2 != 10)
sample 7
i=7
o(10,10)

DimPlot(nCoV.list[[i]], label=T,repel=T, group.by="RNA_snn_res.1.2")&NoLegend()&
    theme(axis.line = element_blank(),
          axis.title = element_blank(),
          axis.text = element_blank(),
          axis.ticks=element_blank()
         )

o(5*5, 5*3)
FeaturePlot(nCoV.list[[i]],
            features = c("PTPRC","COL1A1","EPCAM","PECAM1","CD3D",
                         'ITGAM','ITGAX',"CD68",'S100A9',"FCGR3B",
                         'CD79A','CD4','CD8A','IL7R','CCR7',
                         "CD44","IL2RA",'ITGAE','SELL','CD69'),
            ncol=5
)&theme(axis.line = element_blank(),
        axis.title = element_blank(),
        axis.text = element_blank(),
        axis.ticks=element_blank()
)


nCoV.list[[i]] <- subset(nCoV.list[[i]] , RNA_snn_res.1.2 != 1)
nCoV.list[[i]] <- subset(nCoV.list[[i]] , RNA_snn_res.1.2 != 7)
sample 8
i=8
o(10,10)

DimPlot(nCoV.list[[i]], label=T,repel=T, group.by="RNA_snn_res.1.2")&NoLegend()&
    theme(axis.line = element_blank(),
          axis.title = element_blank(),
          axis.text = element_blank(),
          axis.ticks=element_blank()
         )

o(5*5, 5*3)
FeaturePlot(nCoV.list[[i]],
            features = c("PTPRC","COL1A1","EPCAM","PECAM1","CD3D",
                         'ITGAM','ITGAX',"CD68",'S100A9',"FCGR3B",
                         'CD79A','CD4','CD8A','IL7R','CCR7',
                         "CD44","IL2RA",'ITGAE','SELL','CD69'),
            ncol=5
)&theme(axis.line = element_blank(),
        axis.title = element_blank(),
        axis.text = element_blank(),
        axis.ticks=element_blank()
)


nCoV.list[[i]] <- subset(nCoV.list[[i]] , RNA_snn_res.1.2 != 9)
nCoV.list[[i]] <- subset(nCoV.list[[i]] , RNA_snn_res.1.2 != 7)
sample 9
i=9
o(10,10)

DimPlot(nCoV.list[[i]], label=T,repel=T, group.by="RNA_snn_res.1.2")&NoLegend()&
    theme(axis.line = element_blank(),
          axis.title = element_blank(),
          axis.text = element_blank(),
          axis.ticks=element_blank()
         )

o(5*5, 5*3)
FeaturePlot(nCoV.list[[i]],
            features = c("PTPRC","COL1A1","EPCAM","PECAM1","CD3D",
                         'ITGAM','ITGAX',"CD68",'S100A9',"FCGR3B",
                         'CD79A','CD4','CD8A','IL7R','CCR7',
                         "CD44","IL2RA",'ITGAE','SELL','CD69'),
            ncol=5
)&theme(axis.line = element_blank(),
        axis.title = element_blank(),
        axis.text = element_blank(),
        axis.ticks=element_blank()
)


nCoV.list[[i]] <- subset(nCoV.list[[i]] , RNA_snn_res.1.2 != 13)
nCoV.list[[i]] <- subset(nCoV.list[[i]] , RNA_snn_res.1.2 != 15)
nCoV.list[[i]] <- subset(nCoV.list[[i]] , RNA_snn_res.1.2 != 17)
nCoV.list[[i]] <- subset(nCoV.list[[i]] , RNA_snn_res.1.2 != 19)
nCoV.list[[i]] <- subset(nCoV.list[[i]] , RNA_snn_res.1.2 != 21)
nCoV.list[[i]] <- subset(nCoV.list[[i]] , RNA_snn_res.1.2 != 10)
nCoV.list[[i]] <- subset(nCoV.list[[i]] , RNA_snn_res.1.2 != 18)
nCoV.list[[i]] <- subset(nCoV.list[[i]] , RNA_snn_res.1.2 != 20)
sample 12
i=12
o(10,10)

DimPlot(nCoV.list[[i]], label=T,repel=T, group.by="RNA_snn_res.1.2")&NoLegend()&
    theme(axis.line = element_blank(),
          axis.title = element_blank(),
          axis.text = element_blank(),
          axis.ticks=element_blank()
         )

o(5*5, 5*3)
FeaturePlot(nCoV.list[[i]],
            features = c("PTPRC","COL1A1","EPCAM","PECAM1","CD3D",
                         'ITGAM','ITGAX',"CD68",'S100A9',"FCGR3B",
                         'CD79A','CD4','CD8A','IL7R','CCR7',
                         "CD44","IL2RA",'ITGAE','SELL','CD69'),
            ncol=5
)&theme(axis.line = element_blank(),
        axis.title = element_blank(),
        axis.text = element_blank(),
        axis.ticks=element_blank()
)


nCoV.list[[i]] <- subset(nCoV.list[[i]] , RNA_snn_res.1.2 != 12)
nCoV.list[[i]] <- subset(nCoV.list[[i]] , RNA_snn_res.1.2 != 7)
sample 13
i=13
o(10,10)

DimPlot(nCoV.list[[i]], label=T,repel=T, group.by="RNA_snn_res.1.2")&NoLegend()&
    theme(axis.line = element_blank(),
          axis.title = element_blank(),
          axis.text = element_blank(),
          axis.ticks=element_blank()
         )

o(5*5, 5*3)
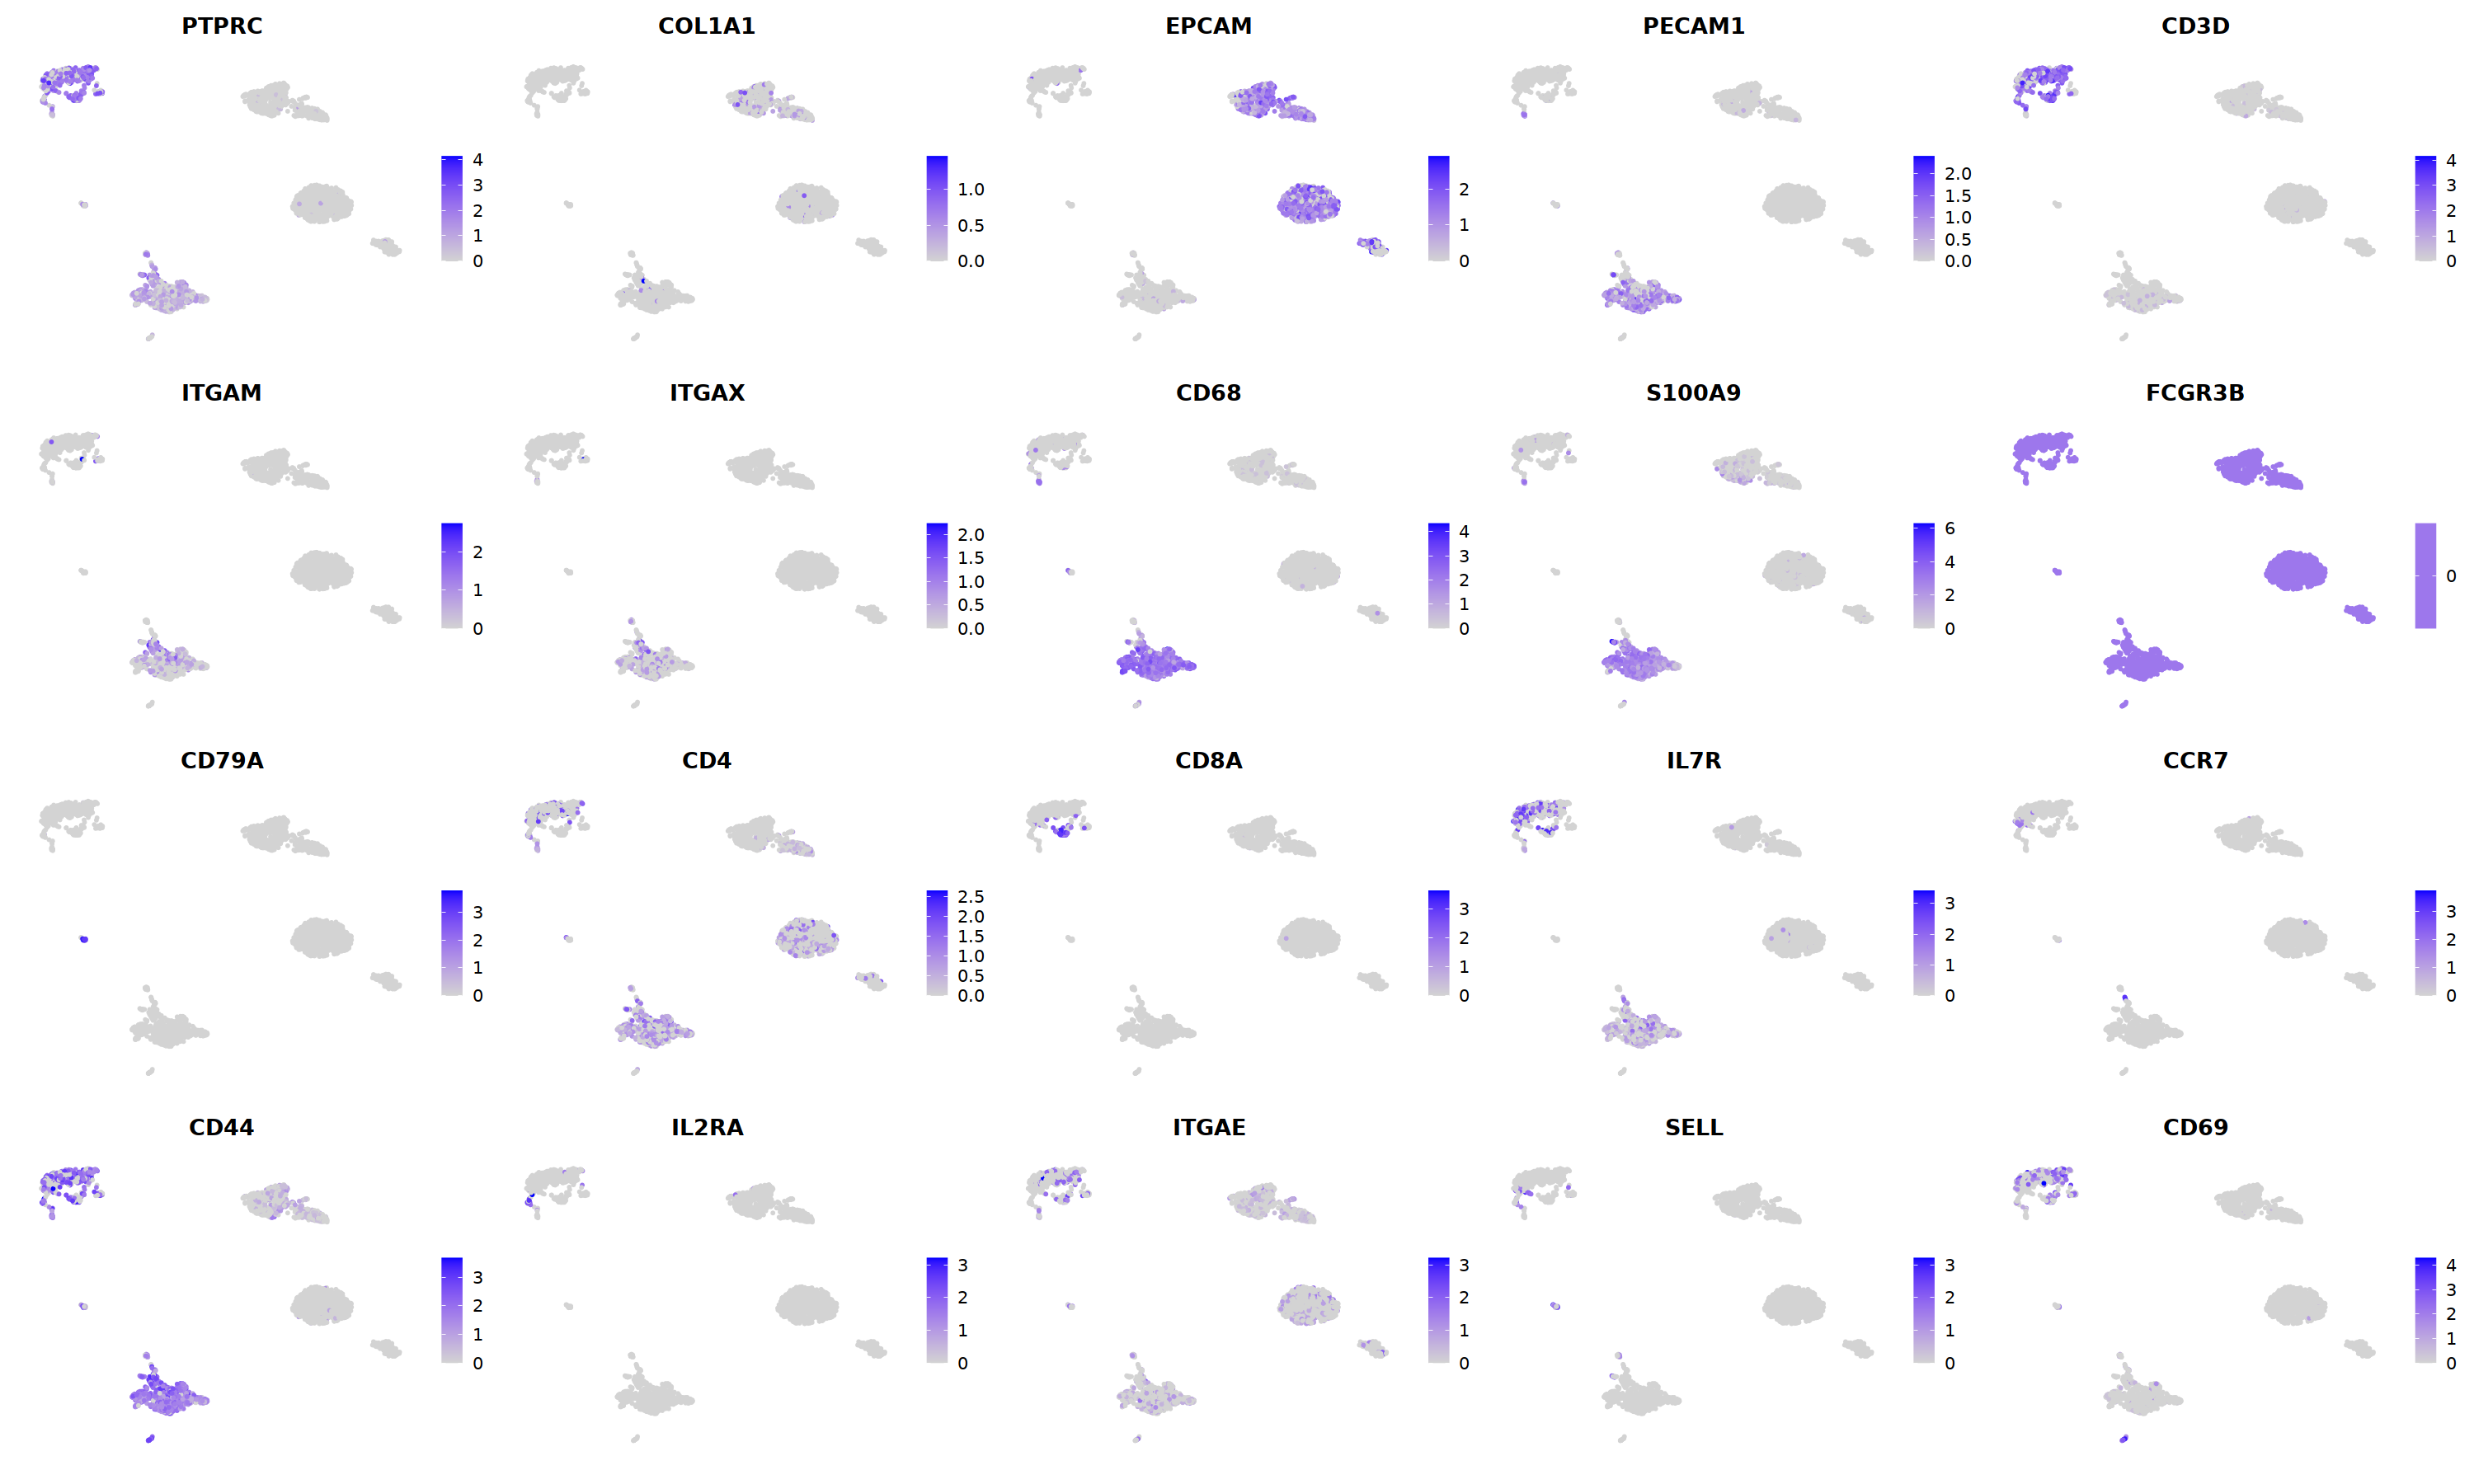
FeaturePlot(nCoV.list[[i]],
            features = c("PTPRC","COL1A1","EPCAM","PECAM1","CD3D",
                         'ITGAM','ITGAX',"CD68",'S100A9',"FCGR3B",
                         'CD79A','CD4','CD8A','IL7R','CCR7',
                         "CD44","IL2RA",'ITGAE','SELL','CD69'),
            ncol=5
)&theme(axis.line = element_blank(),
        axis.title = element_blank(),
        axis.text = element_blank(),
        axis.ticks=element_blank()
)
Warning message in FeaturePlot(nCoV.list[[i]], features = c("PTPRC", "COL1A1", "EPCAM", :
“All cells have the same value (0) of FCGR3B.”

nCoV.list[[i]] <- subset(nCoV.list[[i]] , RNA_snn_res.1.2 != 0 )
nCoV.list[[i]] <- subset(nCoV.list[[i]] , RNA_snn_res.1.2 != 2 )
nCoV.list[[i]] <- subset(nCoV.list[[i]] , RNA_snn_res.1.2 != 4 )
nCoV.list[[i]] <- subset(nCoV.list[[i]] , RNA_snn_res.1.2 != 6 )
nCoV.list[[i]] <- subset(nCoV.list[[i]] , RNA_snn_res.1.2 != 5 )
nCoV.list[[i]] <- subset(nCoV.list[[i]] , RNA_snn_res.1.2 != 7)
per-sample reclustering after filtering
nCoV.selected <- nCoV.list[c(1,2,3,5,6,7,8,9,12,13)]
nCoV.selected
$M1
An object of class Seurat
25916 features across 3368 samples within 2 assays
Active assay: RNA (23916 features, 2000 variable features)
 1 other assay present: integrated
 2 dimensional reductions calculated: pca, umap

$M2
An object of class Seurat
25916 features across 2952 samples within 2 assays
Active assay: RNA (23916 features, 2000 variable features)
 1 other assay present: integrated
 2 dimensional reductions calculated: pca, umap

$S2
An object of class Seurat
25916 features across 9839 samples within 2 assays
Active assay: RNA (23916 features, 2000 variable features)
 1 other assay present: integrated
 2 dimensional reductions calculated: pca, umap

$S1
An object of class Seurat
25916 features across 11018 samples within 2 assays
Active assay: RNA (23916 features, 2000 variable features)
 1 other assay present: integrated
 2 dimensional reductions calculated: pca, umap

$S3
An object of class Seurat
25916 features across 855 samples within 2 assays
Active assay: RNA (23916 features, 2000 variable features)
 1 other assay present: integrated
 2 dimensional reductions calculated: pca, umap

$S4
An object of class Seurat
25916 features across 1321 samples within 2 assays
Active assay: RNA (23916 features, 2000 variable features)
 1 other assay present: integrated
 2 dimensional reductions calculated: pca, umap

$S5
An object of class Seurat
25916 features across 1807 samples within 2 assays
Active assay: RNA (23916 features, 2000 variable features)
 1 other assay present: integrated
 2 dimensional reductions calculated: pca, umap

$S6
An object of class Seurat
25916 features across 2151 samples within 2 assays
Active assay: RNA (23916 features, 2000 variable features)
 1 other assay present: integrated
 2 dimensional reductions calculated: pca, umap

$HC3
An object of class Seurat
25916 features across 2168 samples within 2 assays
Active assay: RNA (23916 features, 2000 variable features)
 1 other assay present: integrated
 2 dimensional reductions calculated: pca, umap

$HC4
An object of class Seurat
25916 features across 1243 samples within 2 assays
Active assay: RNA (23916 features, 2000 variable features)
 1 other assay present: integrated
 2 dimensional reductions calculated: pca, umap
library(tictoc)
tic()
save(nCoV.selected,
     file = 'nCoV.imm.rda',
     compress = T, compression_level = 9)
toc()
x=nCoV.list[[1]]

masked.genes<-c(
    c(grep("^RPL", rownames(x), value = T),grep("^RPS", rownames(x), value = T)),

    grep("^MT-", rownames(x), value = T),

    c(grep("^IFI", rownames(x), value = T),grep("^ISG", rownames(x), value = T)),

    grep("^SMC[0-9]*", rownames(x), value = T),

    grep("^MCM[0-9]*", rownames(x), value = T),

    c(grep("^TUBA", rownames(x), value = T),
      grep("^TUBB", rownames(x), value = T),
      grep("^TUBD[0-9]", rownames(x), value = T),
      grep("^TUBE[0-9]", rownames(x), value = T),
      grep("^TUBG[0-9]", rownames(x), value = T)
    ),

    c(Seurat::cc.genes.updated.2019$s.genes,
      Seurat::cc.genes.updated.2019$g2m.genes
    ),

    c("H1-0","H1-1","H1-10","H1-12P","H1-2","H1-3","H1-4","H1-5","H1-6","H1-7","H1-8",
    "H1-9P","H2AB1","H2AB2","H2AB3","H2AC1","H2AC10P","H2AC11","H2AC12","H2AC13","H2AC14",
    "H2AC15","H2AC16","H2AC17","H2AC18","H2AC19","H2AC20","H2AC21","H2AC2P","H2AC3P","H2AC4",
    "H2AC5P","H2AC6","H2AC7","H2AC8","H2AC9P","H2AJ","H2AL1MP","H2AL1Q","H2AL3",
    "H2AP","H2AQ1P","H2AW","H2AX","H2AZ1","H2AZ2","MACROH2A1","MACROH2A2","H2BC1","H2BC10",
    "H2BC11","H2BC12","H2BC13","H2BC14","H2BC15","H2BC16P","H2BC17","H2BC18",
    "H2BC19P","H2BC20P","H2BC21","H2BC2P","H2BC3","H2BC4","H2BC5","H2BC6","H2BC7","H2BC8",
    "H2BC9","H2BK1","H2BL1P","H2BN1","H2BC12L","H2BU1","H2BU2P","H2BW1","H2BW2",
    "H2BW3P","H2BW4P","H3-7","H3-3A","H3-3B","H3-4","H3-5","H3C1","H3C10","H3C11","H3C12",
    "H3C13","H3C14","H3C15","H3C2","H3C3","H3C4","H3C5P","H3C6","H3C7","H3C8",
    "H3C9P","H3Y1","H3Y2","CENPA","H4-16","H4C1","H4C10P","H4C11","H4C12","H4C13","H4C14",
    "H4C15","H4C2","H4C3","H4C4","H4C5","H4C6","H4C7","H4C8","H4C9"),
    grep("^HIST", rownames(x), value=T)
)
Error in eval(expr, envir, enclos): object 'nCoV.list' not found
Traceback:
# normalize and identify variable features for each dataset independently
nCoV.list <- lapply(X = nCoV.selected, FUN = function(x) {
    DefaultAssay(x)<-'RNA'
    x <- NormalizeData(x, verbose = F)
    x <- FindVariableFeatures(x, selection.method = "vst", nfeatures = 2000, verbose = F)
    hvg = VariableFeatures(x)
    goi = setdiff(hvg,masked.genes)
    print(length(goi))

    x <- ScaleData(x, features = goi, verbose = F)
    x <- RunPCA(object = x, features = VariableFeatures(x), npcs = 50, verbose = F)
    x <- FindNeighbors(x, reduction = "pca", dims = 1:30, verbose = F)
    x <- RunUMAP(object=x,reduction = "pca", dims = 1:30, verbose = F)
    x <- FindClusters(object=x, resolution = c(0.7,0.9,1.2),verbose = F)

    x
})
[1] 1916
Warning message:
“The default method for RunUMAP has changed from calling Python UMAP via reticulate to the R-native UWOT using the cosine metric
To use Python UMAP via reticulate, set umap.method to 'umap-learn' and metric to 'correlation'
This message will be shown once per session”
[1] 1921
[1] 1905
[1] 1909
[1] 1949
[1] 1923
[1] 1926
[1] 1917
[1] 1918
[1] 1918
names(nCoV.list)
- 'M1'
- 'M2'
- 'S2'
- 'S1'
- 'S3'
- 'S4'
- 'S5'
- 'S6'
- 'HC3'
- 'HC4'
nCoV.list<-nCoV.list[c("HC3","HC4","M1","M2","S1","S2","S3","S4","S5","S6")]
nCoV.list
$HC3
An object of class Seurat
25916 features across 2168 samples within 2 assays
Active assay: RNA (23916 features, 2000 variable features)
 1 other assay present: integrated
 2 dimensional reductions calculated: pca, umap

$HC4
An object of class Seurat
25916 features across 1243 samples within 2 assays
Active assay: RNA (23916 features, 2000 variable features)
 1 other assay present: integrated
 2 dimensional reductions calculated: pca, umap

$M1
An object of class Seurat
25916 features across 3368 samples within 2 assays
Active assay: RNA (23916 features, 2000 variable features)
 1 other assay present: integrated
 2 dimensional reductions calculated: pca, umap

$M2
An object of class Seurat
25916 features across 2952 samples within 2 assays
Active assay: RNA (23916 features, 2000 variable features)
 1 other assay present: integrated
 2 dimensional reductions calculated: pca, umap

$S1
An object of class Seurat
25916 features across 11018 samples within 2 assays
Active assay: RNA (23916 features, 2000 variable features)
 1 other assay present: integrated
 2 dimensional reductions calculated: pca, umap

$S2
An object of class Seurat
25916 features across 9839 samples within 2 assays
Active assay: RNA (23916 features, 2000 variable features)
 1 other assay present: integrated
 2 dimensional reductions calculated: pca, umap

$S3
An object of class Seurat
25916 features across 855 samples within 2 assays
Active assay: RNA (23916 features, 2000 variable features)
 1 other assay present: integrated
 2 dimensional reductions calculated: pca, umap

$S4
An object of class Seurat
25916 features across 1321 samples within 2 assays
Active assay: RNA (23916 features, 2000 variable features)
 1 other assay present: integrated
 2 dimensional reductions calculated: pca, umap

$S5
An object of class Seurat
25916 features across 1807 samples within 2 assays
Active assay: RNA (23916 features, 2000 variable features)
 1 other assay present: integrated
 2 dimensional reductions calculated: pca, umap

$S6
An object of class Seurat
25916 features across 2151 samples within 2 assays
Active assay: RNA (23916 features, 2000 variable features)
 1 other assay present: integrated
 2 dimensional reductions calculated: pca, umap
immune.combined <- merge(x=nCoV.list[['HC3']], y=nCoV.list[c("HC4","M1","M2","S1","S2","S3","S4","S5","S6")] )
immune.combined@meta.data$RNA_snn_res.0.7 <- paste(
    immune.combined@meta.data$sample_new,
    immune.combined@meta.data$RNA_snn_res.0.7,sep='_')

immune.combined@meta.data$RNA_snn_res.0.9 <- paste(
    immune.combined@meta.data$sample_new,
    immune.combined@meta.data$RNA_snn_res.0.9,sep='_')

immune.combined@meta.data$RNA_snn_res.1.2 <- paste(
    immune.combined@meta.data$sample_new,
    immune.combined@meta.data$RNA_snn_res.1.2,sep='_')
immune.combined[[]]
| orig.ident | nCount_RNA | nFeature_RNA | group | percent.mt | ID | sample | sample_new | sample_new_old | disease | ⋯ | RNA_snn_res.0.7 | RNA_snn_res.0.9 | RNA_snn_res.1.2 | cxds_score.x | bcds_score.x | hybrid_score.x | percent.disso | cxds_score.y | bcds_score.y | hybrid_score.y | |
|---|---|---|---|---|---|---|---|---|---|---|---|---|---|---|---|---|---|---|---|---|---|
| <chr> | <dbl> | <int> | <chr> | <dbl> | <chr> | <chr> | <chr> | <chr> | <chr> | ⋯ | <chr> | <chr> | <chr> | <dbl> | <dbl> | <dbl> | <dbl> | <dbl> | <dbl> | <dbl> | |
| AAACCCACAGCTACAT-1_12 | C100 | 3123 | 1376 | HC | 9.446045 | AAACCCACAGCTACAT-1_12 | C100 | HC3 | HC3 | N | ⋯ | HC3_5 | HC3_5 | HC3_6 | 52.2671257 | 0.018182570 | 0.07850191 | 1.569004 | 52.2671257 | 0.018182570 | 0.08047192 |
| AAACCCATCCCATTCG-1_12 | C100 | 2341 | 1104 | HC | 6.450235 | AAACCCATCCCATTCG-1_12 | C100 | HC3 | HC3 | N | ⋯ | HC3_10 | HC3_10 | HC3_11 | 90.7514735 | 0.011439134 | 0.11764363 | 2.605724 | 90.7514735 | 0.011439134 | 0.12096609 |
| AAACGAAGTCGCACAC-1_12 | C100 | 12767 | 3409 | HC | 5.381061 | AAACGAAGTCGCACAC-1_12 | C100 | HC3 | HC3 | N | ⋯ | HC3_0 | HC3_0 | HC3_1 | 1.2679328 | 0.102761291 | 0.10308393 | 2.725777 | 1.2679328 | 0.102761291 | 0.10366351 |
| AAACGAAGTCTATGAC-1_12 | C100 | 2198 | 1094 | HC | 9.053685 | AAACGAAGTCTATGAC-1_12 | C100 | HC3 | HC3 | N | ⋯ | HC3_8 | HC3_8 | HC3_9 | 52.0980200 | 0.065456562 | 0.12608018 | 1.819836 | 52.0980200 | 0.065456562 | 0.12829521 |
| AAACGAAGTGTAGTGG-1_12 | C100 | 3413 | 1265 | HC | 8.731321 | AAACGAAGTGTAGTGG-1_12 | C100 | HC3 | HC3 | N | ⋯ | HC3_2 | HC3_2 | HC3_2 | 0.1582943 | 0.023340305 | 0.02148739 | 1.845883 | 0.1582943 | 0.023340305 | 0.02160504 |
| AAACGCTGTCACGTGC-1_12 | C100 | 1622 | 857 | HC | 9.186190 | AAACGCTGTCACGTGC-1_12 | C100 | HC3 | HC3 | N | ⋯ | HC3_8 | HC3_8 | HC3_9 | 1.0679535 | 0.025003349 | 0.02425454 | 1.541307 | 1.0679535 | 0.025003349 | 0.02441384 |
| AAACGCTGTTGGAGGT-1_12 | C100 | 16649 | 3661 | HC | 6.438825 | AAACGCTGTTGGAGGT-1_12 | C100 | HC3 | HC3 | N | ⋯ | HC3_1 | HC3_1 | HC3_0 | 3.3789349 | 0.286385983 | 0.29119582 | 2.889062 | 3.3789349 | 0.286385983 | 0.29282700 |
| AAAGAACTCTAGAACC-1_12 | C100 | 24826 | 4510 | HC | 5.329090 | AAAGAACTCTAGAACC-1_12 | C100 | HC3 | HC3 | N | ⋯ | HC3_1 | HC3_1 | HC3_0 | 586.5748441 | 0.577403426 | 1.28177228 | 2.775316 | 586.5748441 | 0.577403426 | 1.30598739 |
| AAAGAACTCTTTCTAG-1_12 | C100 | 5066 | 1666 | HC | 5.882353 | AAAGAACTCTTTCTAG-1_12 | C100 | HC3 | HC3 | N | ⋯ | HC3_1 | HC3_1 | HC3_0 | 161.6128296 | 0.007541389 | 0.19832559 | 1.421240 | 161.6128296 | 0.007541389 | 0.20418357 |
| AAAGGATTCCGCACTT-1_12 | C100 | 17371 | 3845 | HC | 9.556157 | AAAGGATTCCGCACTT-1_12 | C100 | HC3 | HC3 | N | ⋯ | HC3_0 | HC3_0 | HC3_1 | 7.4317682 | 0.338470489 | 0.34867788 | 2.527201 | 7.4317682 | 0.338470489 | 0.35073194 |
| AAAGGGCAGGATACAT-1_12 | C100 | 19528 | 3680 | HC | 7.128226 | AAAGGGCAGGATACAT-1_12 | C100 | HC3 | HC3 | N | ⋯ | HC3_9 | HC3_9 | HC3_10 | 6.3689133 | 0.264535815 | 0.27268226 | 3.052028 | 6.3689133 | 0.264535815 | 0.27430523 |
| AAAGGGCGTTGAATCC-1_12 | C100 | 22868 | 3876 | HC | 8.938254 | AAAGGGCGTTGAATCC-1_12 | C100 | HC3 | HC3 | N | ⋯ | HC3_1 | HC3_1 | HC3_0 | 425.3305322 | 0.027340643 | 0.53326411 | 2.015917 | 425.3305322 | 0.027340643 | 0.54874052 |
| AAAGGTAGTACTTCCC-1_12 | C100 | 9530 | 3343 | HC | 5.729276 | AAAGGTAGTACTTCCC-1_12 | C100 | HC3 | HC3 | N | ⋯ | HC3_2 | HC3_2 | HC3_2 | 583.5606598 | 0.022712311 | 0.71754198 | 1.469045 | 583.5606598 | 0.022712311 | 0.73870174 |
| AAAGGTAGTCGTAATC-1_12 | C100 | 1751 | 896 | HC | 5.653912 | AAAGGTAGTCGTAATC-1_12 | C100 | HC3 | HC3 | N | ⋯ | HC3_3 | HC3_4 | HC3_5 | 23.4789765 | 0.019089738 | 0.04504047 | 1.599086 | 23.4789765 | 0.019089738 | 0.04597681 |
| AAAGTCCCAGCACAGA-1_12 | C100 | 17135 | 3355 | HC | 6.104465 | AAAGTCCCAGCACAGA-1_12 | C100 | HC3 | HC3 | N | ⋯ | HC3_1 | HC3_1 | HC3_0 | 3.5541465 | 0.074735418 | 0.07748811 | 2.299387 | 3.5541465 | 0.074735418 | 0.07800129 |
| AAAGTCCTCATCGTAG-1_12 | C100 | 13087 | 3329 | HC | 8.833193 | AAAGTCCTCATCGTAG-1_12 | C100 | HC3 | HC3 | N | ⋯ | HC3_0 | HC3_0 | HC3_1 | 2.3723487 | 0.020607803 | 0.02136961 | 2.353481 | 2.3723487 | 0.020607803 | 0.02155262 |
| AAAGTCCTCTGGCTGG-1_12 | C100 | 9792 | 3346 | HC | 5.912990 | AAAGTCCTCTGGCTGG-1_12 | C100 | HC3 | HC3 | N | ⋯ | HC3_2 | HC3_2 | HC3_2 | 9.2034596 | 0.167164177 | 0.17765293 | 2.675654 | 9.2034596 | 0.167164177 | 0.17886089 |
| AAAGTGAAGGCCCAAA-1_12 | C100 | 17295 | 3413 | HC | 9.291703 | AAAGTGAAGGCCCAAA-1_12 | C100 | HC3 | HC3 | N | ⋯ | HC3_1 | HC3_1 | HC3_0 | 687.0214953 | 0.045440499 | 0.86406473 | 2.307025 | 687.0214953 | 0.045440499 | 0.88907744 |
| AAAGTGACAATTGAAG-1_12 | C100 | 20415 | 3851 | HC | 8.959099 | AAAGTGACAATTGAAG-1_12 | C100 | HC3 | HC3 | N | ⋯ | HC3_0 | HC3_0 | HC3_3 | 730.6967932 | 0.434954703 | 1.30990621 | 2.233652 | 730.6967932 | 0.434954703 | 1.33856362 |
| AAAGTGATCTTGCAAG-1_12 | C100 | 7883 | 2747 | HC | 8.106051 | AAAGTGATCTTGCAAG-1_12 | C100 | HC3 | HC3 | N | ⋯ | HC3_0 | HC3_0 | HC3_1 | 0.8875951 | 0.016456047 | 0.01540033 | 1.940885 | 0.8875951 | 0.016456047 | 0.01550772 |
| AAATGGACAAGAGATT-1_12 | C100 | 13120 | 3274 | HC | 4.565549 | AAATGGACAAGAGATT-1_12 | C100 | HC3 | HC3 | N | ⋯ | HC3_0 | HC3_0 | HC3_1 | 488.4775858 | 0.026598422 | 0.60792309 | 1.920732 | 488.4775858 | 0.026598422 | 0.62567351 |
| AAATGGATCATCCTGC-1_12 | C100 | 3598 | 1374 | HC | 2.473596 | AAATGGATCATCCTGC-1_12 | C100 | HC3 | HC3 | N | ⋯ | HC3_5 | HC3_5 | HC3_6 | 43.8622117 | 0.005062414 | 0.05520426 | 1.778766 | 43.8622117 | 0.005062414 | 0.05680137 |
| AACAAAGAGACTCCGC-1_12 | C100 | 17783 | 3760 | HC | 7.715234 | AACAAAGAGACTCCGC-1_12 | C100 | HC3 | HC3 | N | ⋯ | HC3_1 | HC3_1 | HC3_0 | 481.2304129 | 0.131638318 | 0.70543331 | 1.428330 | 481.2304129 | 0.131638318 | 0.72348029 |
| AACAAAGCACTGGCGT-1_12 | C100 | 15462 | 3727 | HC | 8.103738 | AACAAAGCACTGGCGT-1_12 | C100 | HC3 | HC3 | N | ⋯ | HC3_0 | HC3_2 | HC3_2 | 7.5085516 | 0.214727625 | 0.22370166 | 2.218342 | 7.5085516 | 0.214727625 | 0.22510115 |
| AACAACCTCAGCAATC-1_12 | C100 | 19086 | 4021 | HC | 6.774599 | AACAACCTCAGCAATC-1_12 | C100 | HC3 | HC3 | N | ⋯ | HC3_0 | HC3_0 | HC3_1 | 728.5398039 | 0.258565038 | 1.12905190 | 2.017185 | 728.5398039 | 0.258565038 | 1.15669449 |
| AACACACAGATTGACA-1_12 | C100 | 17309 | 3707 | HC | 6.695939 | AACACACAGATTGACA-1_12 | C100 | HC3 | HC3 | N | ⋯ | HC3_0 | HC3_0 | HC3_1 | 723.5701363 | 0.215725437 | 1.07981887 | 3.200647 | 723.5701363 | 0.215725437 | 1.10705461 |
| AACACACAGCTACAAA-1_12 | C100 | 17463 | 3850 | HC | 4.850255 | AACACACAGCTACAAA-1_12 | C100 | HC3 | HC3 | N | ⋯ | HC3_1 | HC3_1 | HC3_0 | 593.6497328 | 0.149337247 | 0.85757103 | 2.989177 | 593.6497328 | 0.149337247 | 0.87976740 |
| AACAGGGAGGAGTCTG-1_12 | C100 | 16712 | 3693 | HC | 9.071326 | AACAGGGAGGAGTCTG-1_12 | C100 | HC3 | HC3 | N | ⋯ | HC3_0 | HC3_0 | HC3_1 | 708.7206032 | 0.040159110 | 0.88463950 | 3.111537 | 708.7206032 | 0.040159110 | 0.91040692 |
| AACAGGGAGGTAGTCG-1_12 | C100 | 15905 | 3343 | HC | 6.186734 | AACAGGGAGGTAGTCG-1_12 | C100 | HC3 | HC3 | N | ⋯ | HC3_0 | HC3_0 | HC3_1 | 0.8224159 | 0.299042851 | 0.30093527 | 1.930211 | 0.8224159 | 0.299042851 | 0.30254146 |
| AACAGGGAGGTTAGTA-1_12 | C100 | 15362 | 3079 | HC | 6.203619 | AACAGGGAGGTTAGTA-1_12 | C100 | HC3 | HC3 | N | ⋯ | HC3_0 | HC3_0 | HC3_1 | 704.6287894 | 0.026469085 | 0.86591651 | 2.362974 | 704.6287894 | 0.026469085 | 0.89146360 |
| ⋮ | ⋮ | ⋮ | ⋮ | ⋮ | ⋮ | ⋮ | ⋮ | ⋮ | ⋮ | ⋮ | ⋱ | ⋮ | ⋮ | ⋮ | ⋮ | ⋮ | ⋮ | ⋮ | ⋮ | ⋮ | ⋮ |
| TTTACTGGTTGTGGAG-1_9 | C152 | 2008 | 903 | S | 7.8187251 | TTTACTGGTTGTGGAG-1_9 | C152 | S6 | C5 | Y | ⋯ | S6_1 | S6_1 | S6_2 | 24117.877 | 0.005157132 | 0.09894915 | 2.9880478 | 24117.877 | 0.005157132 | 0.13018670 |
| TTTACTGTCCCTCAGT-1_9 | C152 | 11160 | 2571 | S | 5.8333333 | TTTACTGTCCCTCAGT-1_9 | C152 | S6 | C5 | Y | ⋯ | S6_1 | S6_7 | S6_8 | 110364.279 | 0.882930398 | 1.31907544 | 2.6433692 | 110364.279 | 0.882930398 | 1.47042592 |
| TTTATGCAGATATGCA-1_9 | C152 | 28721 | 4280 | S | 6.2602277 | TTTATGCAGATATGCA-1_9 | C152 | S6 | C5 | Y | ⋯ | S6_6 | S6_6 | S6_7 | 26920.201 | 0.038680635 | 0.14361094 | 1.7165140 | 26920.201 | 0.038680635 | 0.17879909 |
| TTTATGCAGCGCTTAT-1_9 | C152 | 1270 | 502 | S | 8.7401575 | TTTATGCAGCGCTTAT-1_9 | C152 | S6 | C5 | Y | ⋯ | S6_4 | S6_4 | S6_4 | 30941.530 | 0.012981012 | 0.13368039 | 1.4960630 | 30941.530 | 0.012981012 | 0.17383131 |
| TTTATGCAGCGTAATA-1_9 | C152 | 9134 | 2281 | S | 4.7952704 | TTTATGCAGCGTAATA-1_9 | C152 | S6 | C5 | Y | ⋯ | S6_1 | S6_7 | S6_8 | 78360.161 | 0.297448993 | 0.60580007 | 2.5290125 | 78360.161 | 0.297448993 | 0.71009343 |
| TTTATGCAGTCAATAG-1_9 | C152 | 2047 | 883 | S | 9.6238398 | TTTATGCAGTCAATAG-1_9 | C152 | S6 | C5 | Y | ⋯ | S6_0 | S6_0 | S6_0 | 31584.890 | 0.014390544 | 0.13762880 | 4.5920860 | 31584.890 | 0.014390544 | 0.17862654 |
| TTTATGCAGTTCCACA-1_9 | C152 | 4683 | 1392 | S | 6.1712577 | TTTATGCAGTTCCACA-1_9 | C152 | S6 | C5 | Y | ⋯ | S6_0 | S6_0 | S6_0 | 61904.769 | 0.212742910 | 0.45601508 | 2.9041213 | 61904.769 | 0.212742910 | 0.53818358 |
| TTTATGCCACATCCGG-1_9 | C152 | 3860 | 2076 | S | 8.0310881 | TTTATGCCACATCCGG-1_9 | C152 | S6 | C5 | Y | ⋯ | S6_5 | S6_5 | S6_5 | 19544.104 | 0.022489537 | 0.09831160 | 2.4093264 | 19544.104 | 0.022489537 | 0.12379073 |
| TTTATGCGTAGAAAGG-1_9 | C152 | 1731 | 840 | S | 5.1415367 | TTTATGCGTAGAAAGG-1_9 | C152 | S6 | C5 | Y | ⋯ | S6_1 | S6_1 | S6_2 | 52885.934 | 0.037891123 | 0.24512202 | 4.5060659 | 52885.934 | 0.037891123 | 0.31393533 |
| TTTATGCGTCAGTGGA-1_9 | C152 | 1975 | 941 | S | 0.4050633 | TTTATGCGTCAGTGGA-1_9 | C152 | S6 | C5 | Y | ⋯ | S6_7 | S6_9 | S6_10 | 20486.606 | 0.005140959 | 0.08462602 | 1.7721519 | 20486.606 | 0.005140959 | 0.11115992 |
| TTTATGCGTCGACTGC-1_9 | C152 | 2300 | 537 | S | 7.5217391 | TTTATGCGTCGACTGC-1_9 | C152 | S6 | C5 | Y | ⋯ | S6_6 | S6_6 | S6_7 | 11652.754 | 0.002154427 | 0.04682615 | 1.0000000 | 11652.754 | 0.002154427 | 0.06188922 |
| TTTATGCTCGCACTCT-1_9 | C152 | 1649 | 618 | S | 6.9739236 | TTTATGCTCGCACTCT-1_9 | C152 | S6 | C5 | Y | ⋯ | S6_4 | S6_4 | S6_4 | 43422.553 | 0.023418145 | 0.19332205 | 1.2734991 | 43422.553 | 0.023418145 | 0.24973919 |
| TTTCCTCAGAGACTTA-1_9 | C152 | 4028 | 1769 | S | 3.8728898 | TTTCCTCAGAGACTTA-1_9 | C152 | S6 | C5 | Y | ⋯ | S6_2 | S6_2 | S6_1 | 12783.367 | 0.163374007 | 0.21296847 | 2.5571003 | 12783.367 | 0.163374007 | 0.23103885 |
| TTTCCTCAGATCTGAA-1_9 | C152 | 1354 | 660 | S | 6.4992614 | TTTCCTCAGATCTGAA-1_9 | C152 | S6 | C5 | Y | ⋯ | S6_0 | S6_0 | S6_0 | 33422.721 | 0.006188314 | 0.13664366 | 2.0679468 | 33422.721 | 0.006188314 | 0.17994339 |
| TTTCCTCAGGATGGAA-1_9 | C152 | 2706 | 1062 | S | 5.4323725 | TTTCCTCAGGATGGAA-1_9 | C152 | S6 | C5 | Y | ⋯ | S6_0 | S6_0 | S6_0 | 56867.270 | 0.018621501 | 0.24148257 | 2.9933481 | 56867.270 | 0.018621501 | 0.31526839 |
| TTTCCTCCAGCTCCGA-1_9 | C152 | 6612 | 2491 | S | 5.5353902 | TTTCCTCCAGCTCCGA-1_9 | C152 | S6 | C5 | Y | ⋯ | S6_5 | S6_5 | S6_5 | 49703.918 | 0.328933179 | 0.52447242 | 2.1324864 | 49703.918 | 0.328933179 | 0.59194942 |
| TTTCCTCCAGGTCTCG-1_9 | C152 | 1951 | 834 | S | 7.3808303 | TTTCCTCCAGGTCTCG-1_9 | C152 | S6 | C5 | Y | ⋯ | S6_7 | S6_9 | S6_10 | 11282.835 | 0.032933865 | 0.07623753 | 1.0251153 | 11282.835 | 0.032933865 | 0.09111601 |
| TTTGCGCAGACTACAA-1_9 | C152 | 22478 | 4601 | S | 5.8323694 | TTTGCGCAGACTACAA-1_9 | C152 | S6 | C5 | Y | ⋯ | S6_8 | S6_10 | S6_11 | 134542.706 | 0.291211933 | 0.82089956 | 3.0073850 | 134542.706 | 0.291211933 | 0.99790499 |
| TTTGCGCTCCAGGGCT-1_9 | C152 | 1624 | 510 | S | 9.6674877 | TTTGCGCTCCAGGGCT-1_9 | C152 | S6 | C5 | Y | ⋯ | S6_4 | S6_4 | S6_4 | 10035.620 | 0.003654358 | 0.04195906 | 0.8004926 | 10035.620 | 0.003654358 | 0.05494186 |
| TTTGCGCTCTAACCGA-1_9 | C152 | 4789 | 1978 | S | 3.3409898 | TTTGCGCTCTAACCGA-1_9 | C152 | S6 | C5 | Y | ⋯ | S6_2 | S6_2 | S6_1 | 9009.994 | 0.058215968 | 0.09263825 | 1.7957820 | 9009.994 | 0.058215968 | 0.10481473 |
| TTTGGTTAGATCCCGC-1_9 | C152 | 11612 | 2679 | S | 3.1174647 | TTTGGTTAGATCCCGC-1_9 | C152 | S6 | C5 | Y | ⋯ | S6_1 | S6_1 | S6_6 | 120643.781 | 0.304931104 | 0.77989794 | 2.7988288 | 120643.781 | 0.304931104 | 0.93903175 |
| TTTGGTTAGCACCGTC-1_9 | C152 | 2591 | 1160 | S | 5.9050560 | TTTGGTTAGCACCGTC-1_9 | C152 | S6 | C5 | Y | ⋯ | S6_0 | S6_0 | S6_0 | 39725.914 | 0.011988726 | 0.16729498 | 2.5086839 | 39725.914 | 0.011988726 | 0.21881458 |
| TTTGGTTAGTCTCCTC-1_9 | C152 | 1878 | 923 | S | 6.4430245 | TTTGGTTAGTCTCCTC-1_9 | C152 | S6 | C5 | Y | ⋯ | S6_0 | S6_0 | S6_0 | 37526.898 | 0.016176116 | 0.16283059 | 2.7689031 | 37526.898 | 0.016176116 | 0.21154194 |
| TTTGGTTCACGAGAGT-1_9 | C152 | 6063 | 2097 | S | 4.1398648 | TTTGGTTCACGAGAGT-1_9 | C152 | S6 | C5 | Y | ⋯ | S6_0 | S6_0 | S6_0 | 118655.393 | 0.671489358 | 1.13968665 | 2.2596075 | 118655.393 | 0.671489358 | 1.29975291 |
| TTTGGTTCACTATCTT-1_9 | C152 | 7536 | 2640 | S | 6.0509554 | TTTGGTTCACTATCTT-1_9 | C152 | S6 | C5 | Y | ⋯ | S6_5 | S6_5 | S6_5 | 26398.732 | 0.053244974 | 0.15616303 | 3.0254777 | 26398.732 | 0.053244974 | 0.19081511 |
| TTTGGTTCATCGGGTC-1_9 | C152 | 4104 | 1450 | S | 7.6267057 | TTTGGTTCATCGGGTC-1_9 | C152 | S6 | C5 | Y | ⋯ | S6_1 | S6_7 | S6_8 | 67002.646 | 0.102086306 | 0.36512233 | 2.3635478 | 67002.646 | 0.102086306 | 0.45283499 |
| TTTGGTTGTCTCTCTG-1_9 | C152 | 3916 | 1451 | S | 9.0653728 | TTTGGTTGTCTCTCTG-1_9 | C152 | S6 | C5 | Y | ⋯ | S6_1 | S6_0 | S6_2 | 66699.359 | 0.214363128 | 0.47653030 | 3.1664964 | 66699.359 | 0.214363128 | 0.56492460 |
| TTTGTCACAACACCCG-1_9 | C152 | 1347 | 556 | S | 9.3541203 | TTTGTCACAACACCCG-1_9 | C152 | S6 | C5 | Y | ⋯ | S6_4 | S6_4 | S6_4 | 21219.327 | 0.011220686 | 0.09361026 | 1.6332591 | 21219.327 | 0.011220686 | 0.12115142 |
| TTTGTCAGTCTGCAAT-1_9 | C152 | 21274 | 3373 | S | 4.7663815 | TTTGTCAGTCTGCAAT-1_9 | C152 | S6 | C5 | Y | ⋯ | S6_3 | S6_3 | S6_3 | 33608.836 | 0.037904564 | 0.16918529 | 1.1939457 | 33608.836 | 0.037904564 | 0.21302962 |
| TTTGTCAGTGTTGGGA-1_9 | C152 | 4301 | 1705 | S | 6.4868635 | TTTGTCAGTGTTGGGA-1_9 | C152 | S6 | C5 | Y | ⋯ | S6_0 | S6_0 | S6_0 | 98058.258 | 0.488923788 | 0.87543984 | 2.4180423 | 98058.258 | 0.488923788 | 1.00708003 |
integration
rm(nCoV.list)
gc()
| used | (Mb) | gc trigger | (Mb) | max used | (Mb) | |
|---|---|---|---|---|---|---|
| Ncells | 3173438 | 169.5 | 5685265 | 303.7 | 5685265 | 303.7 |
| Vcells | 3664278487 | 27956.3 | 5340092296 | 40741.7 | 4424213420 | 33754.1 |
rm(nCoV.selected)
gc()
| used | (Mb) | gc trigger | (Mb) | max used | (Mb) | |
|---|---|---|---|---|---|---|
| Ncells | 3172482 | 169.5 | 5685265 | 303.7 | 5685265 | 303.7 |
| Vcells | 2518723637 | 19216.4 | 5340092296 | 40741.7 | 4424213420 | 33754.1 |
harmony
library(harmony)
DefaultAssay(immune.combined)<-'RNA'
immune.combined %>% Seurat::NormalizeData(verbose = FALSE) %>%
FindVariableFeatures(selection.method = "vst", nfeatures = 2000) %>%
ScaleData(verbose = FALSE, features = rownames(immune.combined)) -> immune.combined

hvg = VariableFeatures(immune.combined)
goi = setdiff(hvg,masked.genes)

immune.combined <- RunPCA(object = immune.combined, features =goi,
                          npcs = 50, verbose = FALSE)
Loading required package: Rcpp
length(goi)
immune.combined
An object of class Seurat
25916 features across 36722 samples within 2 assays
Active assay: RNA (23916 features, 2000 variable features)
 1 other assay present: integrated
 1 dimensional reduction calculated: pca
o(10,10)
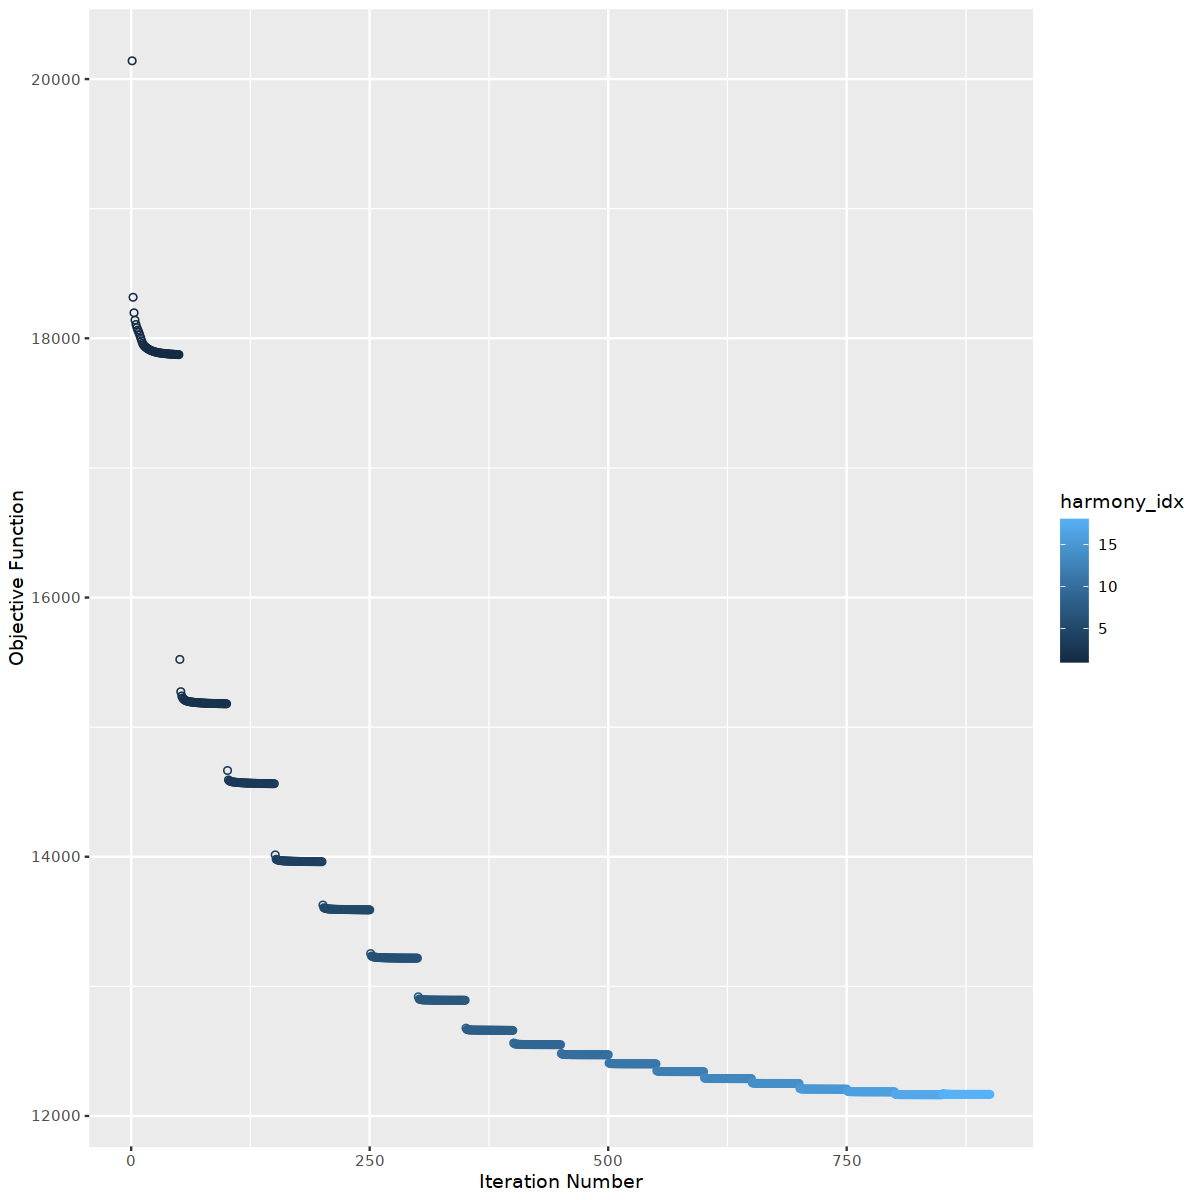
immune.combined <- RunHarmony(
    object = immune.combined,
    group.by.vars= "sample_new",
    theta =3,  # larger theta make more diverse clusters
    lambda=2, # smaller lambda make integration more aggressive
    max.iter.harmony=100,
    max.iter.cluster=50,
    epsilon.cluster=-Inf, # don't stop early
    plot_convergence = TRUE

)
Harmony 1/100

Harmony 2/100

Harmony 3/100

Harmony 4/100

Harmony 5/100

Harmony 6/100

Harmony 7/100

Harmony 8/100

Harmony 9/100

Harmony 10/100

Harmony 11/100

Harmony 12/100

Harmony 13/100

Harmony 14/100

Harmony 15/100

Harmony 16/100

Harmony 17/100

Harmony 18/100

Harmony converged after 18 iterations

Warning message:
“Invalid name supplied, making object name syntactically valid. New object name is Seurat..ProjectDim.RNA.harmony; see ?make.names for more details on syntax validity”
immune.combined <- RunUMAP(immune.combined,reduction = "harmony", verbose=F, dims = 1:20)

immune.combined <- FindNeighbors(immune.combined, reduction = "harmony",
                                 graph.name ='harmony_snn', dims = 1:20, verbose=F)

immune.combined <- FindClusters(immune.combined, graph.name = 'harmony_snn',
                                algorithm=2,
                                n.start = 10, n.iter=100, random.seed=42,
                                resolution = c(0.1,0.3,0.5,0.7,0.9,1.2,1.5), verbose=F)
Only one graph name supplied, storing nearest-neighbor graph only
o(9,8)
DimPlot(immune.combined, group.by = 'harmony_snn_res.0.3', label=T, repel=T)

Idents(immune.combined)<- 'harmony_snn_res.0.3'
deg.0.3<-FindAllMarkers(immune.combined, only.pos = T,
                        logfc.threshold = 1, return.thresh = 0.001, min.pct = 0.3,
                        features = VariableFeatures(immune.combined))
Calculating cluster 0

Calculating cluster 1

Calculating cluster 10

Calculating cluster 2

Calculating cluster 3

Calculating cluster 4

Calculating cluster 5

Calculating cluster 6

Calculating cluster 7

Calculating cluster 8

Calculating cluster 9
deg.0.3 %>% filter(p_val_adj<0.01) %>% arrange(cluster,desc(avg_log2FC)) %>%
 group_by(cluster) %>% top_n(n = 10, wt = avg_log2FC) %>% pull(gene) %>% unique -> deg.viz

o(10,20)
DotPlot(immune.combined, features = rev(deg.viz)) &coord_flip()

drop non-immune cells
immune.combined <- subset(immune.combined, harmony_snn_res.0.3!=8 )
reclustering after dropping
immune.list <- SplitObject(immune.combined, split.by = "sample_new")
for (i in 1:length(immune.list)) {
    immune.list[[i]] <- NormalizeData(immune.list[[i]], verbose = FALSE)
    immune.list[[i]] <- FindVariableFeatures(immune.list[[i]], selection.method = "vst",
        nfeatures = 2000, verbose = FALSE)
}
integration.features <- SelectIntegrationFeatures(object.list = immune.list, nfeatures = 2000)
x=immune.combined

masked.genes<-c(
    c(grep("^RPL", rownames(x), value = T),grep("^RPS", rownames(x), value = T)),

    grep("^MT-", rownames(x), value = T),

    c(grep("^IFI", rownames(x), value = T),grep("^ISG", rownames(x), value = T)),

    grep("^SMC[0-9]*", rownames(x), value = T),

    grep("^MCM[0-9]*", rownames(x), value = T),

    c(grep("^TUBA", rownames(x), value = T),
      grep("^TUBB", rownames(x), value = T),
      grep("^TUBD[0-9]", rownames(x), value = T),
      grep("^TUBE[0-9]", rownames(x), value = T),
      grep("^TUBG[0-9]", rownames(x), value = T)
    ),

    c(Seurat::cc.genes.updated.2019$s.genes,
      Seurat::cc.genes.updated.2019$g2m.genes
    ),

    c("H1-0","H1-1","H1-10","H1-12P","H1-2","H1-3","H1-4","H1-5","H1-6","H1-7","H1-8",
    "H1-9P","H2AB1","H2AB2","H2AB3","H2AC1","H2AC10P","H2AC11","H2AC12","H2AC13","H2AC14",
    "H2AC15","H2AC16","H2AC17","H2AC18","H2AC19","H2AC20","H2AC21","H2AC2P","H2AC3P","H2AC4",
    "H2AC5P","H2AC6","H2AC7","H2AC8","H2AC9P","H2AJ","H2AL1MP","H2AL1Q","H2AL3",
    "H2AP","H2AQ1P","H2AW","H2AX","H2AZ1","H2AZ2","MACROH2A1","MACROH2A2","H2BC1","H2BC10",
    "H2BC11","H2BC12","H2BC13","H2BC14","H2BC15","H2BC16P","H2BC17","H2BC18",
    "H2BC19P","H2BC20P","H2BC21","H2BC2P","H2BC3","H2BC4","H2BC5","H2BC6","H2BC7","H2BC8",
    "H2BC9","H2BK1","H2BL1P","H2BN1","H2BC12L","H2BU1","H2BU2P","H2BW1","H2BW2",
    "H2BW3P","H2BW4P","H3-7","H3-3A","H3-3B","H3-4","H3-5","H3C1","H3C10","H3C11","H3C12",
    "H3C13","H3C14","H3C15","H3C2","H3C3","H3C4","H3C5P","H3C6","H3C7","H3C8",
    "H3C9P","H3Y1","H3Y2","CENPA","H4-16","H4C1","H4C10P","H4C11","H4C12","H4C13","H4C14",
    "H4C15","H4C2","H4C3","H4C4","H4C5","H4C6","H4C7","H4C8","H4C9"),
    grep("^HIST", rownames(x), value=T)
)
integration.features <- setdiff(integration.features, masked.genes)
integration.anchors <- FindIntegrationAnchors(
    object.list = immune.list,
    anchor.features = integration.features,
    verbose = FALSE
)

immune.combined <- IntegrateData(anchorset = integration.anchors,
                                 verbose = FALSE)
DefaultAssay(immune.combined) <- "integrated"

immune.combined<-ScaleData(immune.combined, verbose = FALSE)
immune.combined<-RunPCA(immune.combined, npcs = 30, verbose = FALSE)
immune.combined<-RunUMAP(immune.combined, reduction = "pca", dims = 1:30, verbose = FALSE)
DefaultAssay(immune.combined) <- "integrated"
immune.combined<-FindNeighbors(immune.combined, verbose = F,dims = 1:30)
immune.combined<-FindClusters(immune.combined, resolution = c(0.3,0.5,0.7,0.9,1.2),verbose = F)
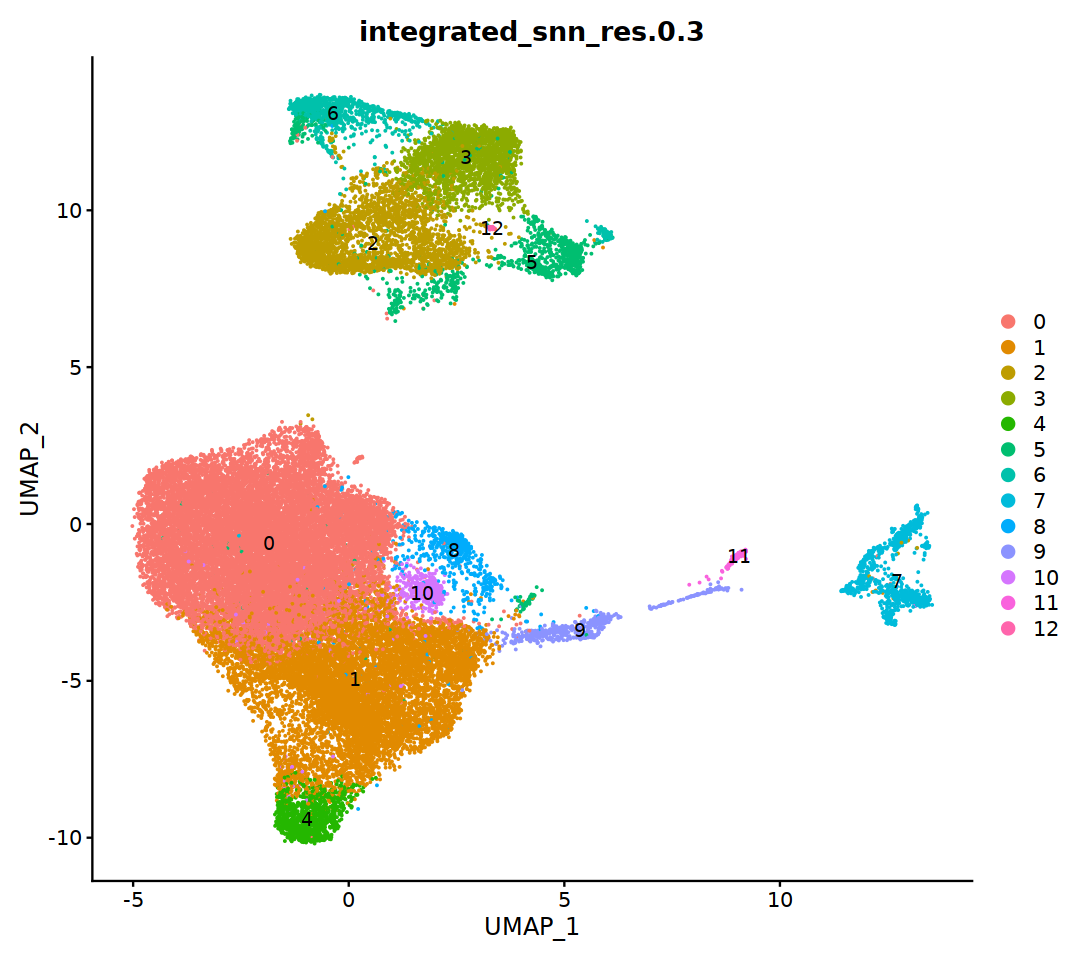
DimPlot(immune.combined, group.by='integrated_snn_res.0.3', label=T)
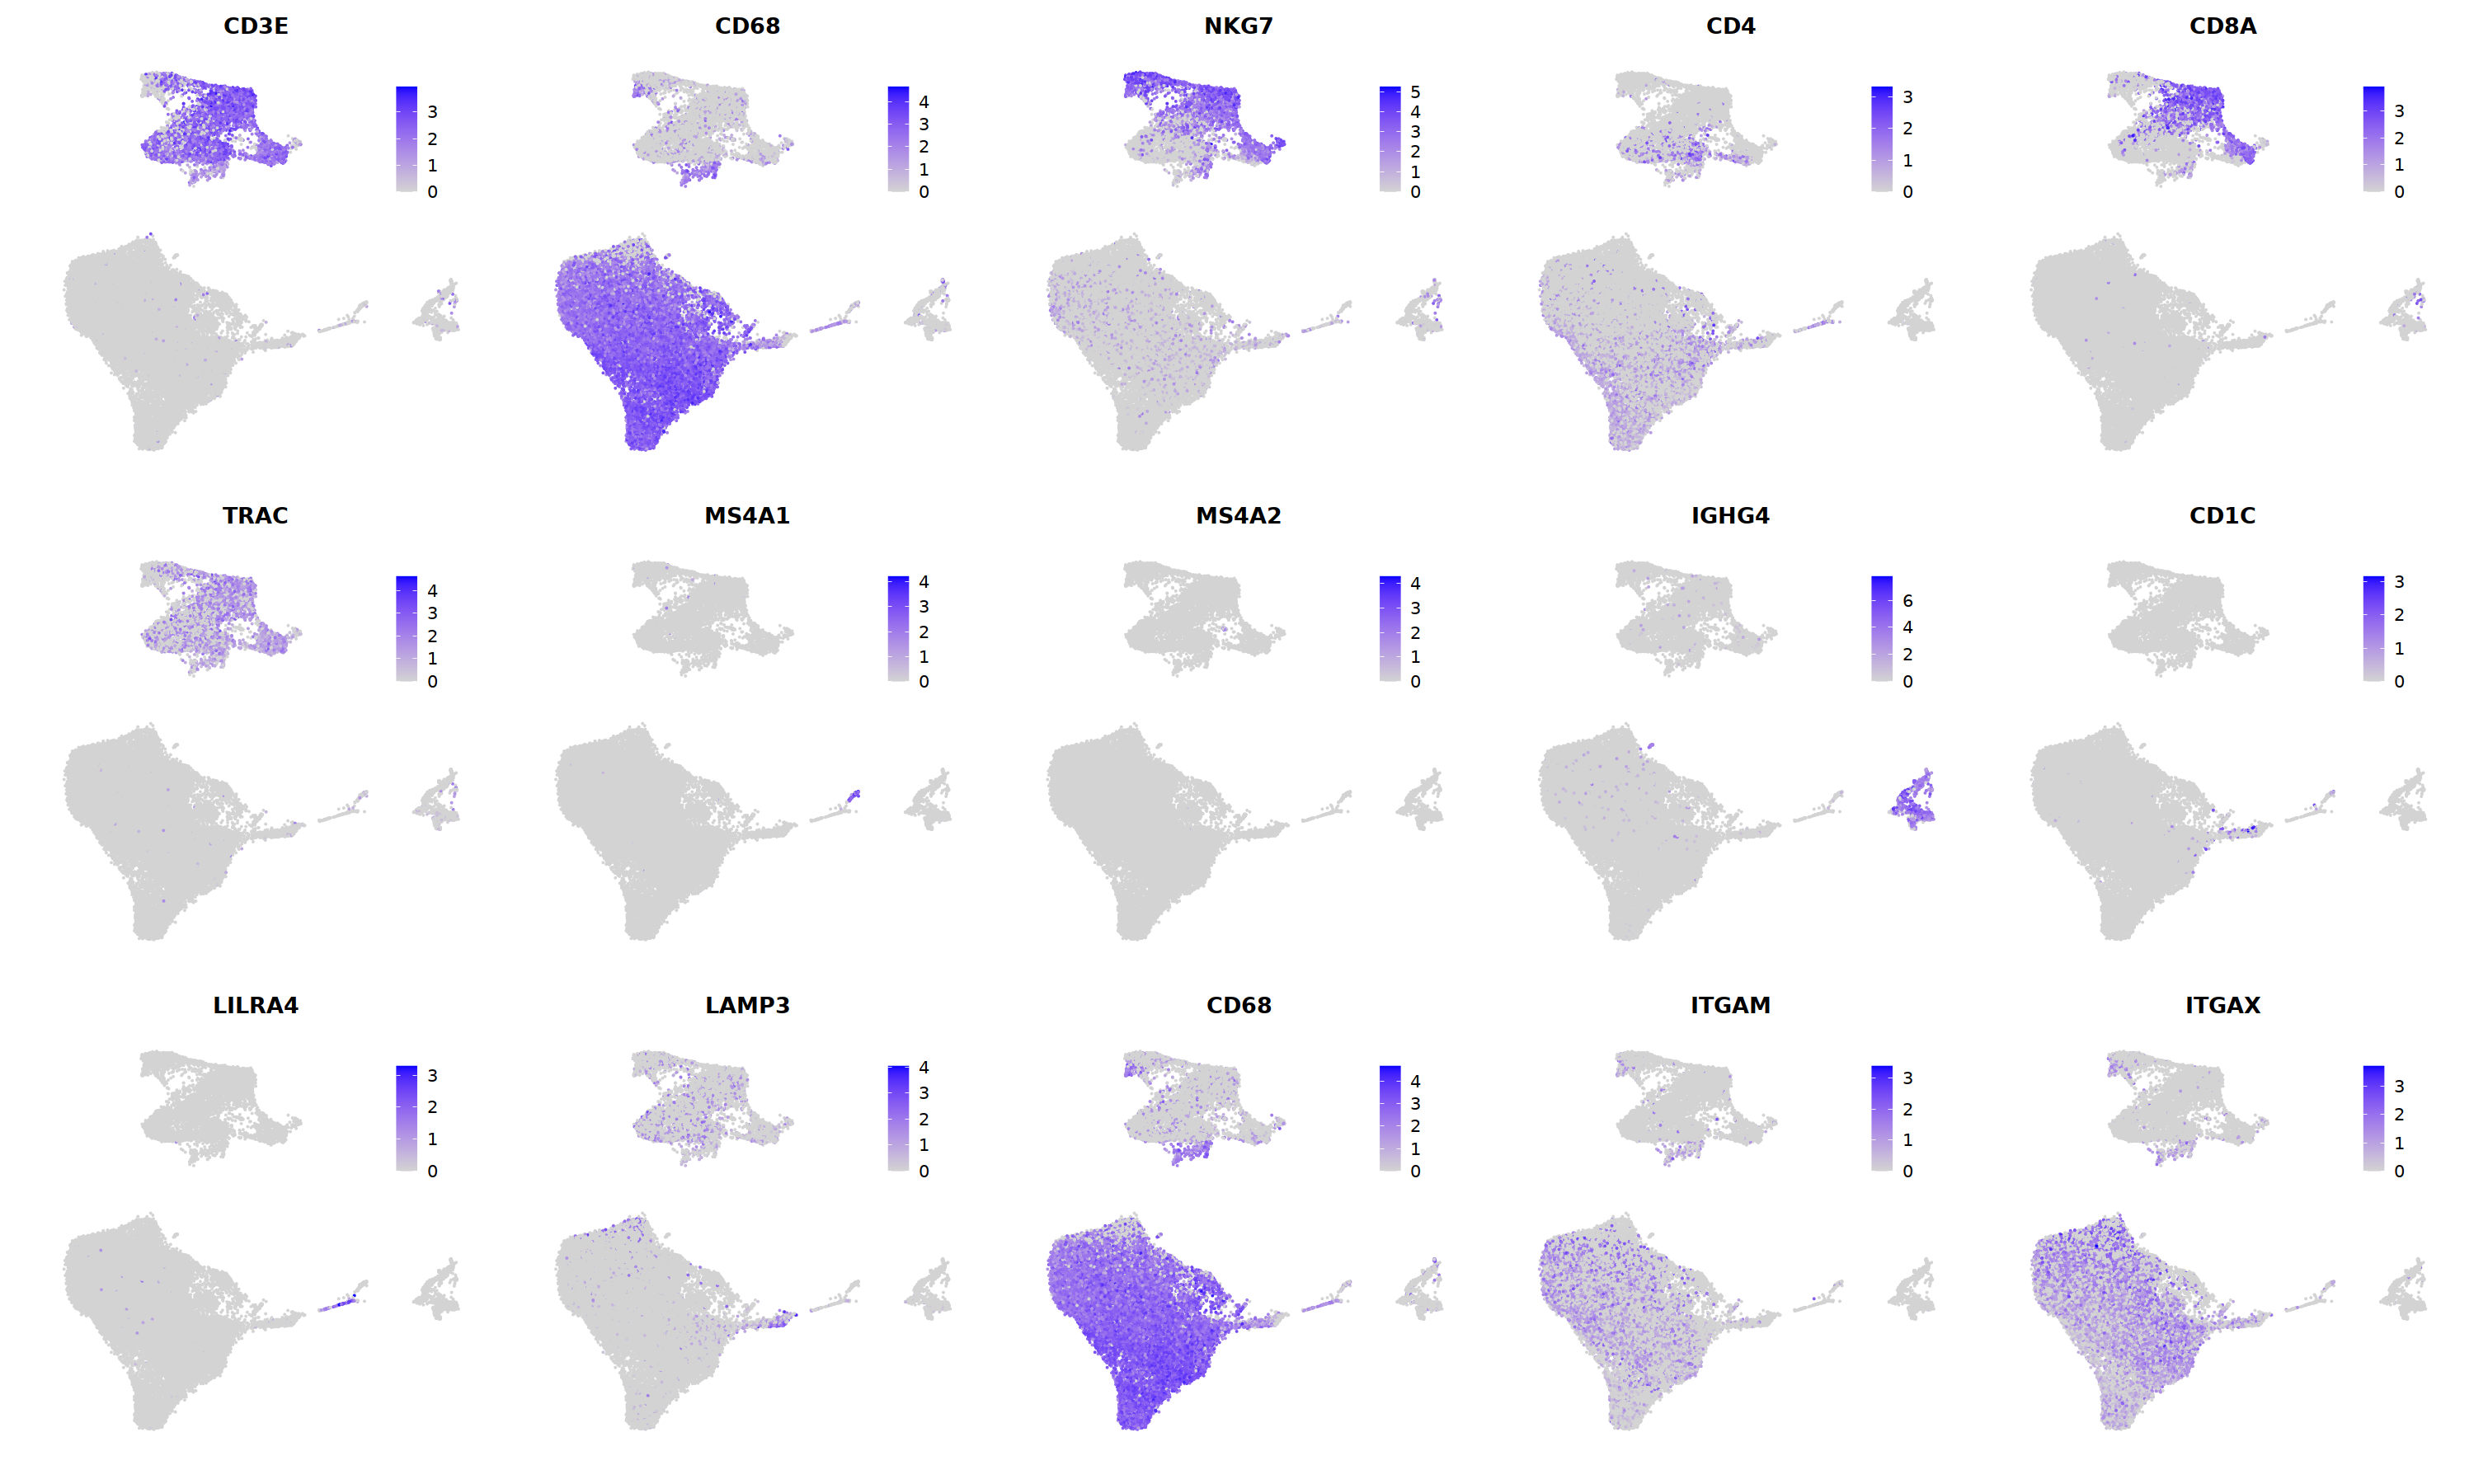
o(5*5, 5*3)
FeaturePlot(immune.combined, ncol=5,
features = c('CD3E','CD68','NKG7','CD4','CD8A',
             'TRAC','MS4A1','MS4A2','IGHG4','CD1C',
             'LILRA4','LAMP3','CD68','ITGAM','ITGAX')
)&theme(legend.position=c(0.8,0.8))&theme(axis.line = element_blank(),
axis.title = element_blank(),axis.text = element_blank(), axis.ticks=element_blank()
)
Idents(immune.combined)<-'integrated_snn_res.0.3'
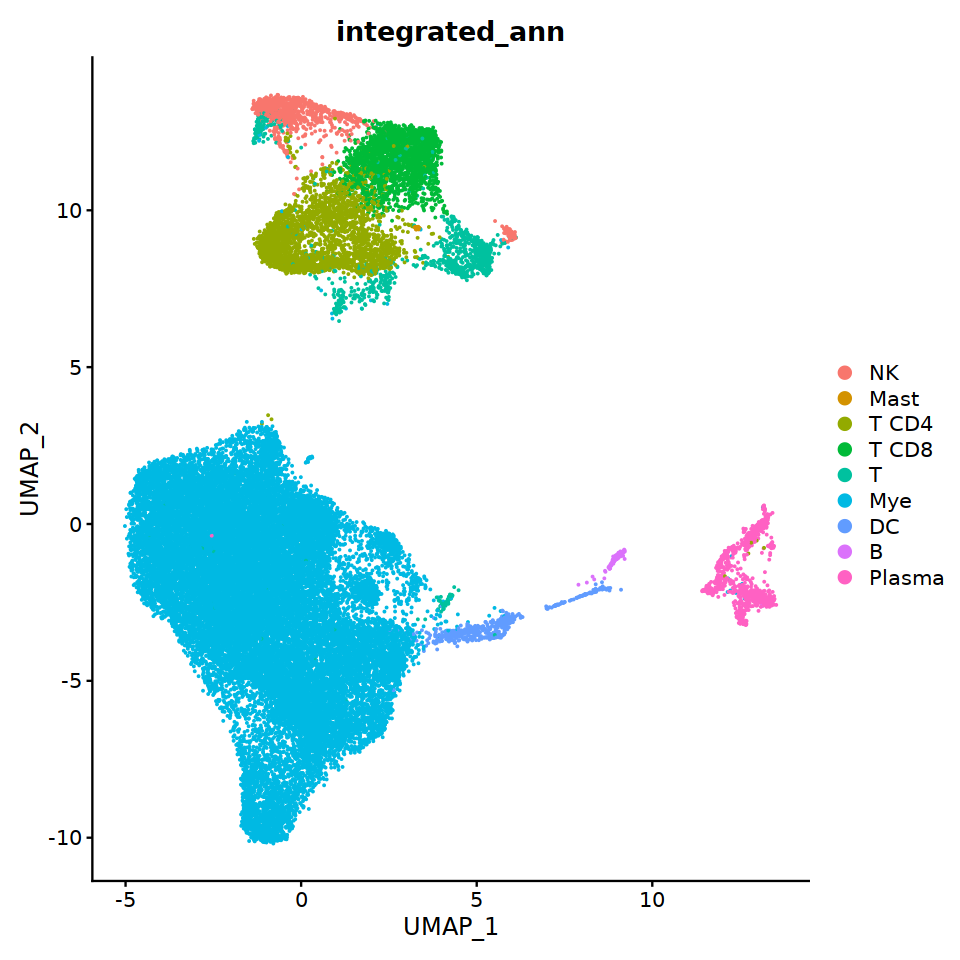
immune.combined= RenameIdents(immune.combined,
             '6'='NK','12'='Mast',
             '2'='T CD4', '3'='T CD8', '5'='T',
             '0'='Mye','1'='Mye','4'='Mye','10'='Mye','8'='Mye',
             '9'='DC','11'='B','7'='Plasma'
            )
Idents(immune.combined) -> immune.combined[['integrated_ann']]
o(8,8)
DimPlot(immune.combined, group.by='integrated_ann')
split by batch
immune.list= SplitObject(immune.combined, split.by = 'sample_new')
names(immune.list)
- 'HC3'
- 'HC4'
- 'M1'
- 'M2'
- 'S1'
- 'S2'
- 'S3'
- 'S4'
- 'S5'
- 'S6'
for (i in 1:length(immune.list)) {
    DefaultAssay(immune.list[[i]]) <- 'RNA'
    immune.list[[i]] <- NormalizeData(immune.list[[i]], verbose = FALSE)
    immune.list[[i]] <- FindVariableFeatures(immune.list[[i]],
                                             selection.method = "vst",
                                             nfeatures = 2000, verbose = FALSE)
    immune.list[[i]] <- ScaleData(immune.list[[i]],
                                  features = VariableFeatures(immune.list[[i]]),
                                  verbose = F)
    immune.list[[i]] <- RunPCA(immune.list[[i]],npcs = 30, features = VariableFeatures(immune.list[[i]]), verbose = F)
    immune.list[[i]] <- RunUMAP(immune.list[[i]], dims = 1:30, verbose = F)
    immune.list[[i]] <- FindNeighbors(immune.list[[i]], dims = 1:30, verbose = F)
    immune.list[[i]] <- FindClusters(immune.list[[i]], dims = 1:30,resolution = c(0.1,0.3,0.5,0.7,0.9), verbose = F)

}
Warning message:
“The following arguments are not used: dims”
Warning message:
“The following arguments are not used: dims”
Warning message:
“The following arguments are not used: dims”
Warning message:
“The following arguments are not used: dims”
Warning message:
“The following arguments are not used: dims”
Warning message:
“The following arguments are not used: dims”
Warning message:
“The following arguments are not used: dims”
Warning message:
“The following arguments are not used: dims”
Warning message:
“The following arguments are not used: dims”
Warning message:
“The following arguments are not used: dims”
Warning message:
“The following arguments are not used: dims”
Warning message:
“The following arguments are not used: dims”
Warning message:
“The following arguments are not used: dims”
Warning message:
“The following arguments are not used: dims”
Warning message:
“The following arguments are not used: dims”
Warning message:
“The following arguments are not used: dims”
Warning message:
“The following arguments are not used: dims”
Warning message:
“The following arguments are not used: dims”
Warning message:
“The following arguments are not used: dims”
Warning message:
“The following arguments are not used: dims”
per-sample annotation
HC3
# context switching
sample_name='HC3'

seu= immune.list[[sample_name]]
group.by= 'RNA_snn_res.0.7'

o(17,8)
ggarrange(
    DimPlot(seu, group.by=group.by, label=T,repel=T, label.size = 5),
    DimPlot(seu, group.by='integrated_ann',  label=T,repel=T, label.size = 5),
    nrow=1, ncol=2
)

# adopt integrated_ann first
seu@meta.data[, "persample_ann"] = as.character(seu@meta.data[, "integrated_ann"] )
DC
# DC markers
o(5*5, 5*3)
FeaturePlot(seu, ncol = 5,pt.size=0.01,
            features = c('CST3','FCER1A','ITGAX',# pan DC
                         'LAMP3','CLEC9A',#cDC1
                         "CD1C",'HLA-DQA1',"PLD4",# cDC2
                         'LILRA4','LILRB4','IRF8','CCR7', #pDC
                         'CCL17','CLEC10A'#moDC
                        )
           )&theme(
legend.position=c(0.8,0.8),
axis.line = element_blank(),
axis.title = element_blank(),axis.text = element_blank(), axis.ticks=element_blank()
)

# 6 is cDC2
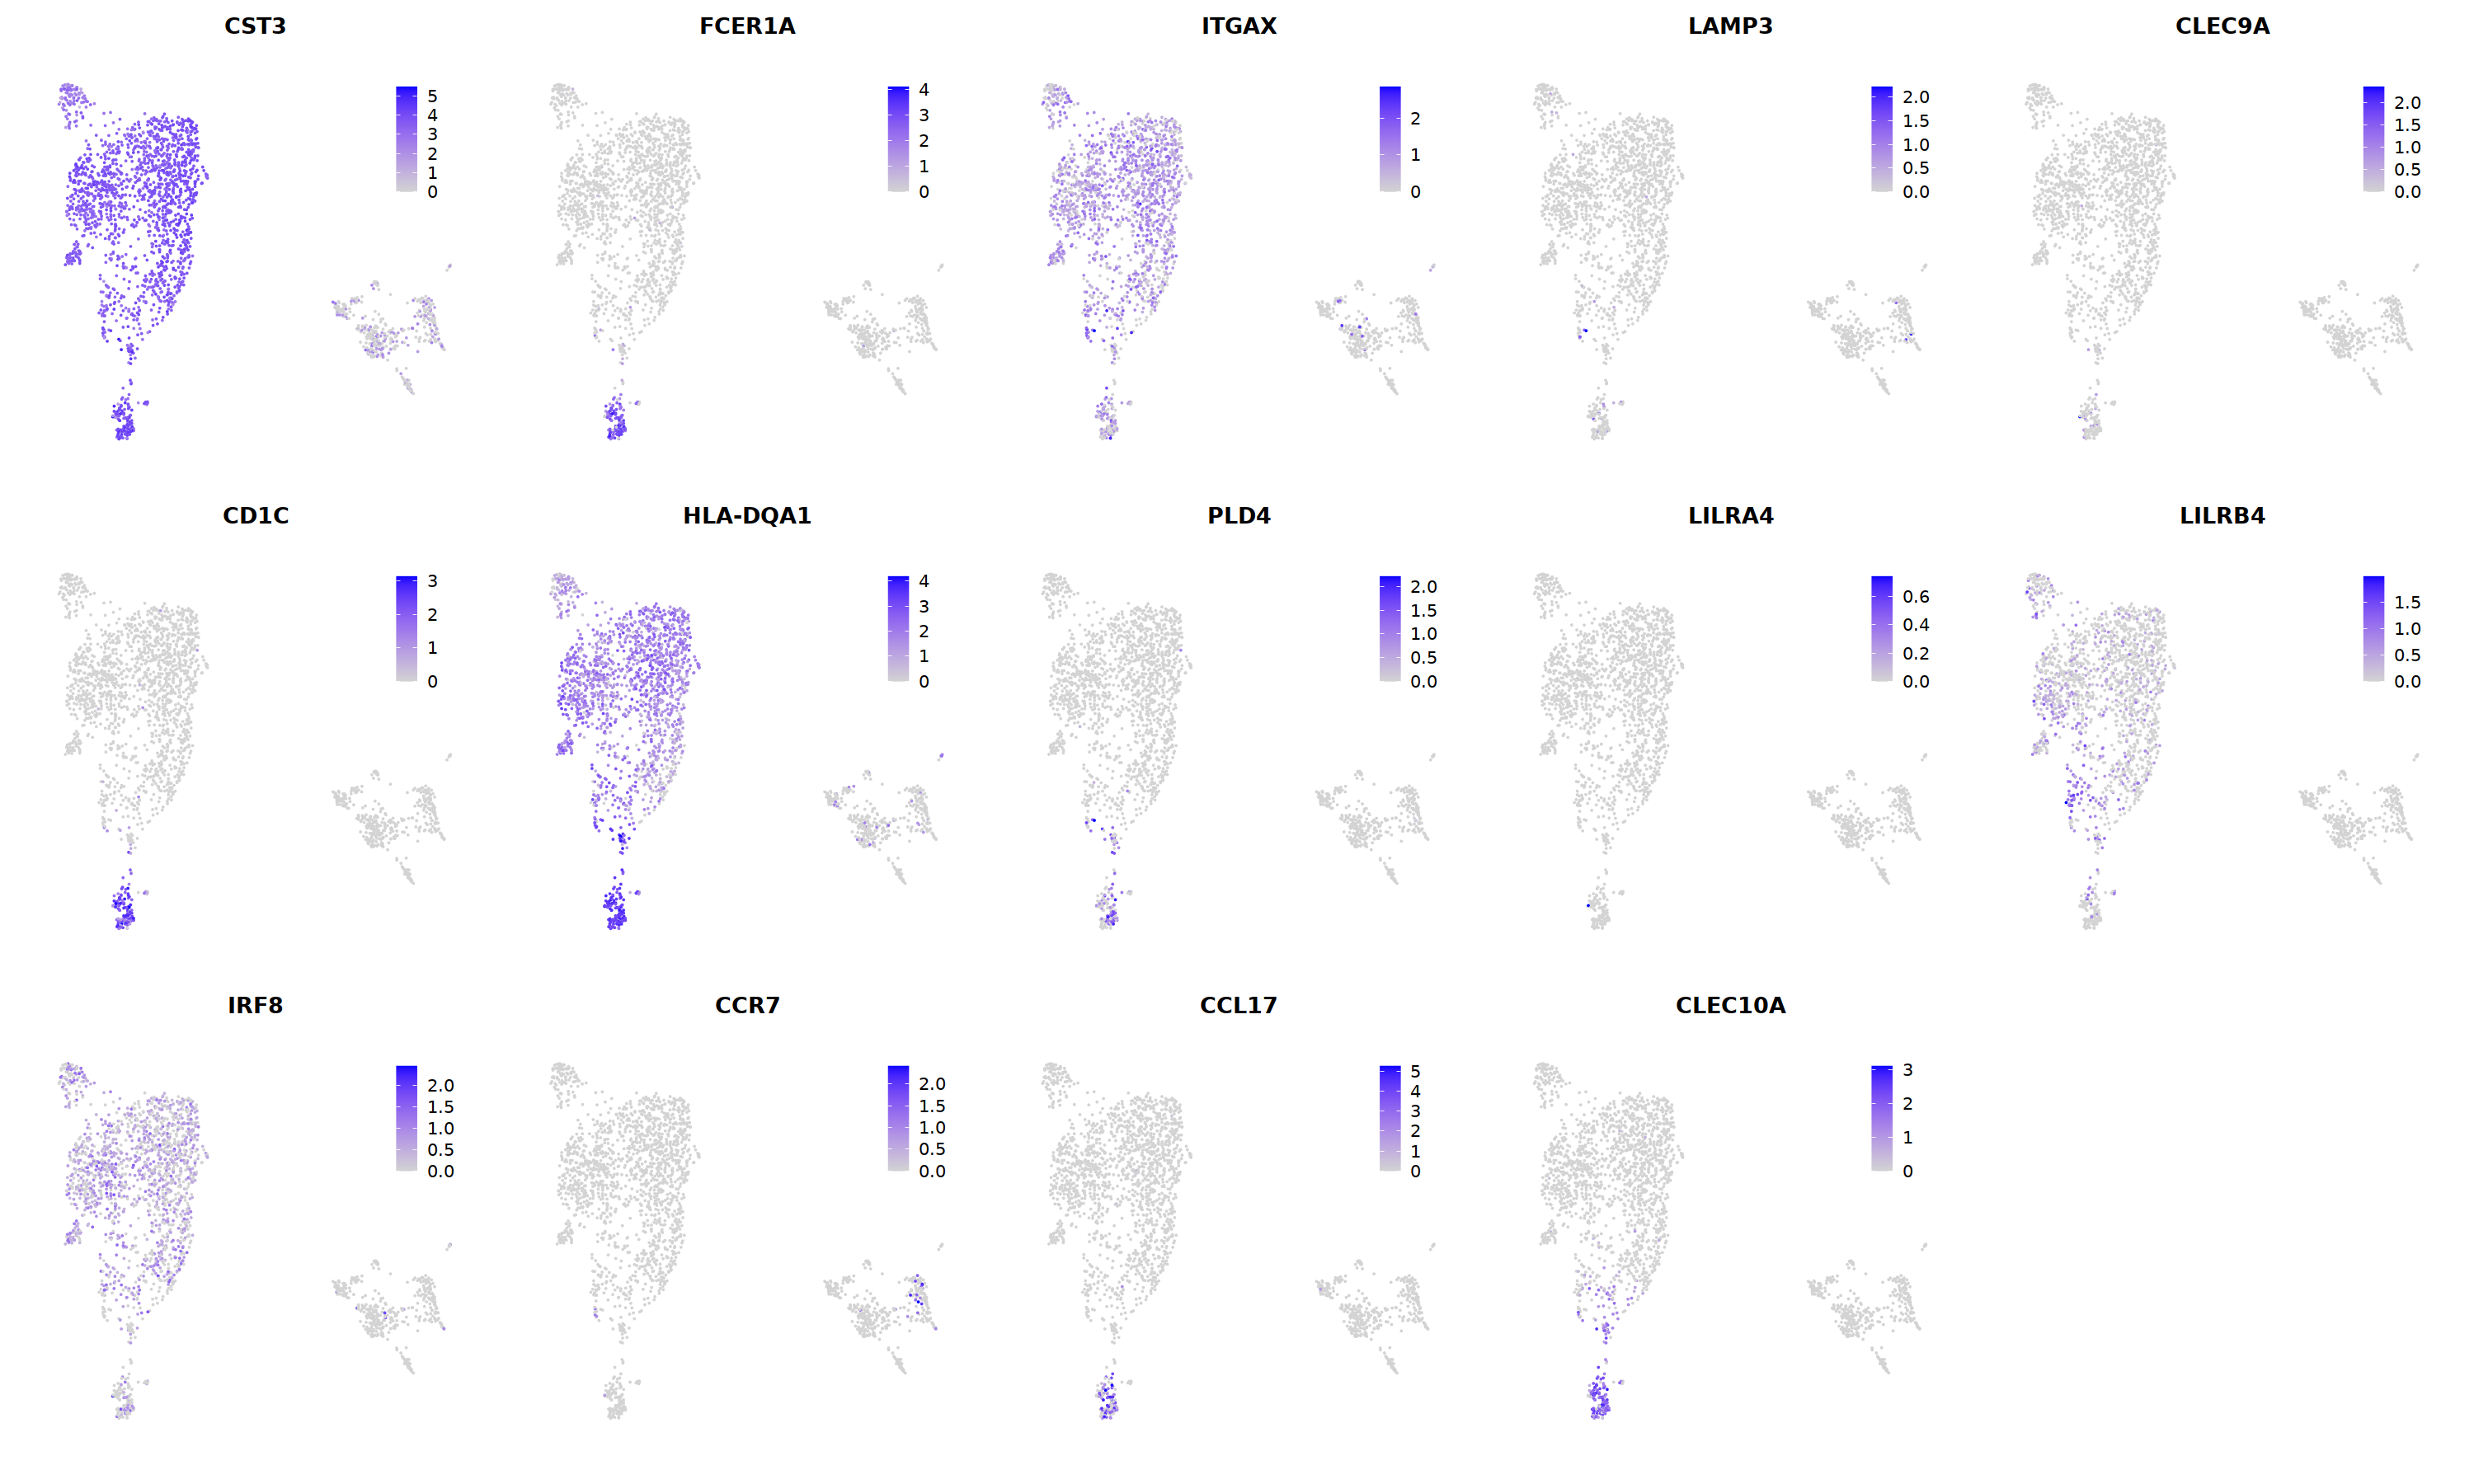
cell.sel = Cells(subset(seu, RNA_snn_res.0.7==6))
seu@meta.data[cell.sel, "persample_ann"] = 'cDC2'
Mac
# macrophages
o(5*5, 5*9)
FeaturePlot(seu, ncol = 5, pt.size=0.01,
            features = c("CD14",'LYZ',"FCGR3A",
'OLR1','CDKN1C','LILRB2',"ITGAL",
'CDKN1C','LILRB2','ITGAL',
'S100A12','PROK2','S100A8','VCAN',
'NT5E','ANGPTL4','CXCL5','BAG3',
'DNASE2',
'MMP7','TIMP3','CHI3L1','FABP5',
'CHIT1','GDF15','CTSK',#
'CCL18','PLTP','CD209','F13A1',#
'FABP4','RBP4','PPARG','MARCO', #
'CXCL12','IGSF21','C3',
'CXCL9','CXCL10','CXCL11','GBP1', #
'CCL17',"CLEC10A",
"TOP2A","MKI67",'CDK1')
)&theme(
legend.position=c(0.8,0.8),
axis.line = element_blank(),
axis.title = element_blank(),axis.text = element_blank(), axis.ticks=element_blank()
)
Warning message in FeaturePlot(seu, ncol = 5, pt.size = 0.01, features = c("CD14", :
“All cells have the same value (0) of ANGPTL4.”
Warning message in FeaturePlot(seu, ncol = 5, pt.size = 0.01, features = c("CD14", :
“All cells have the same value (0) of MMP7.”
Warning message in FeaturePlot(seu, ncol = 5, pt.size = 0.01, features = c("CD14", :
“All cells have the same value (0) of TIMP3.”
Warning message in FeaturePlot(seu, ncol = 5, pt.size = 0.01, features = c("CD14", :
“All cells have the same value (0) of CXCL12.”
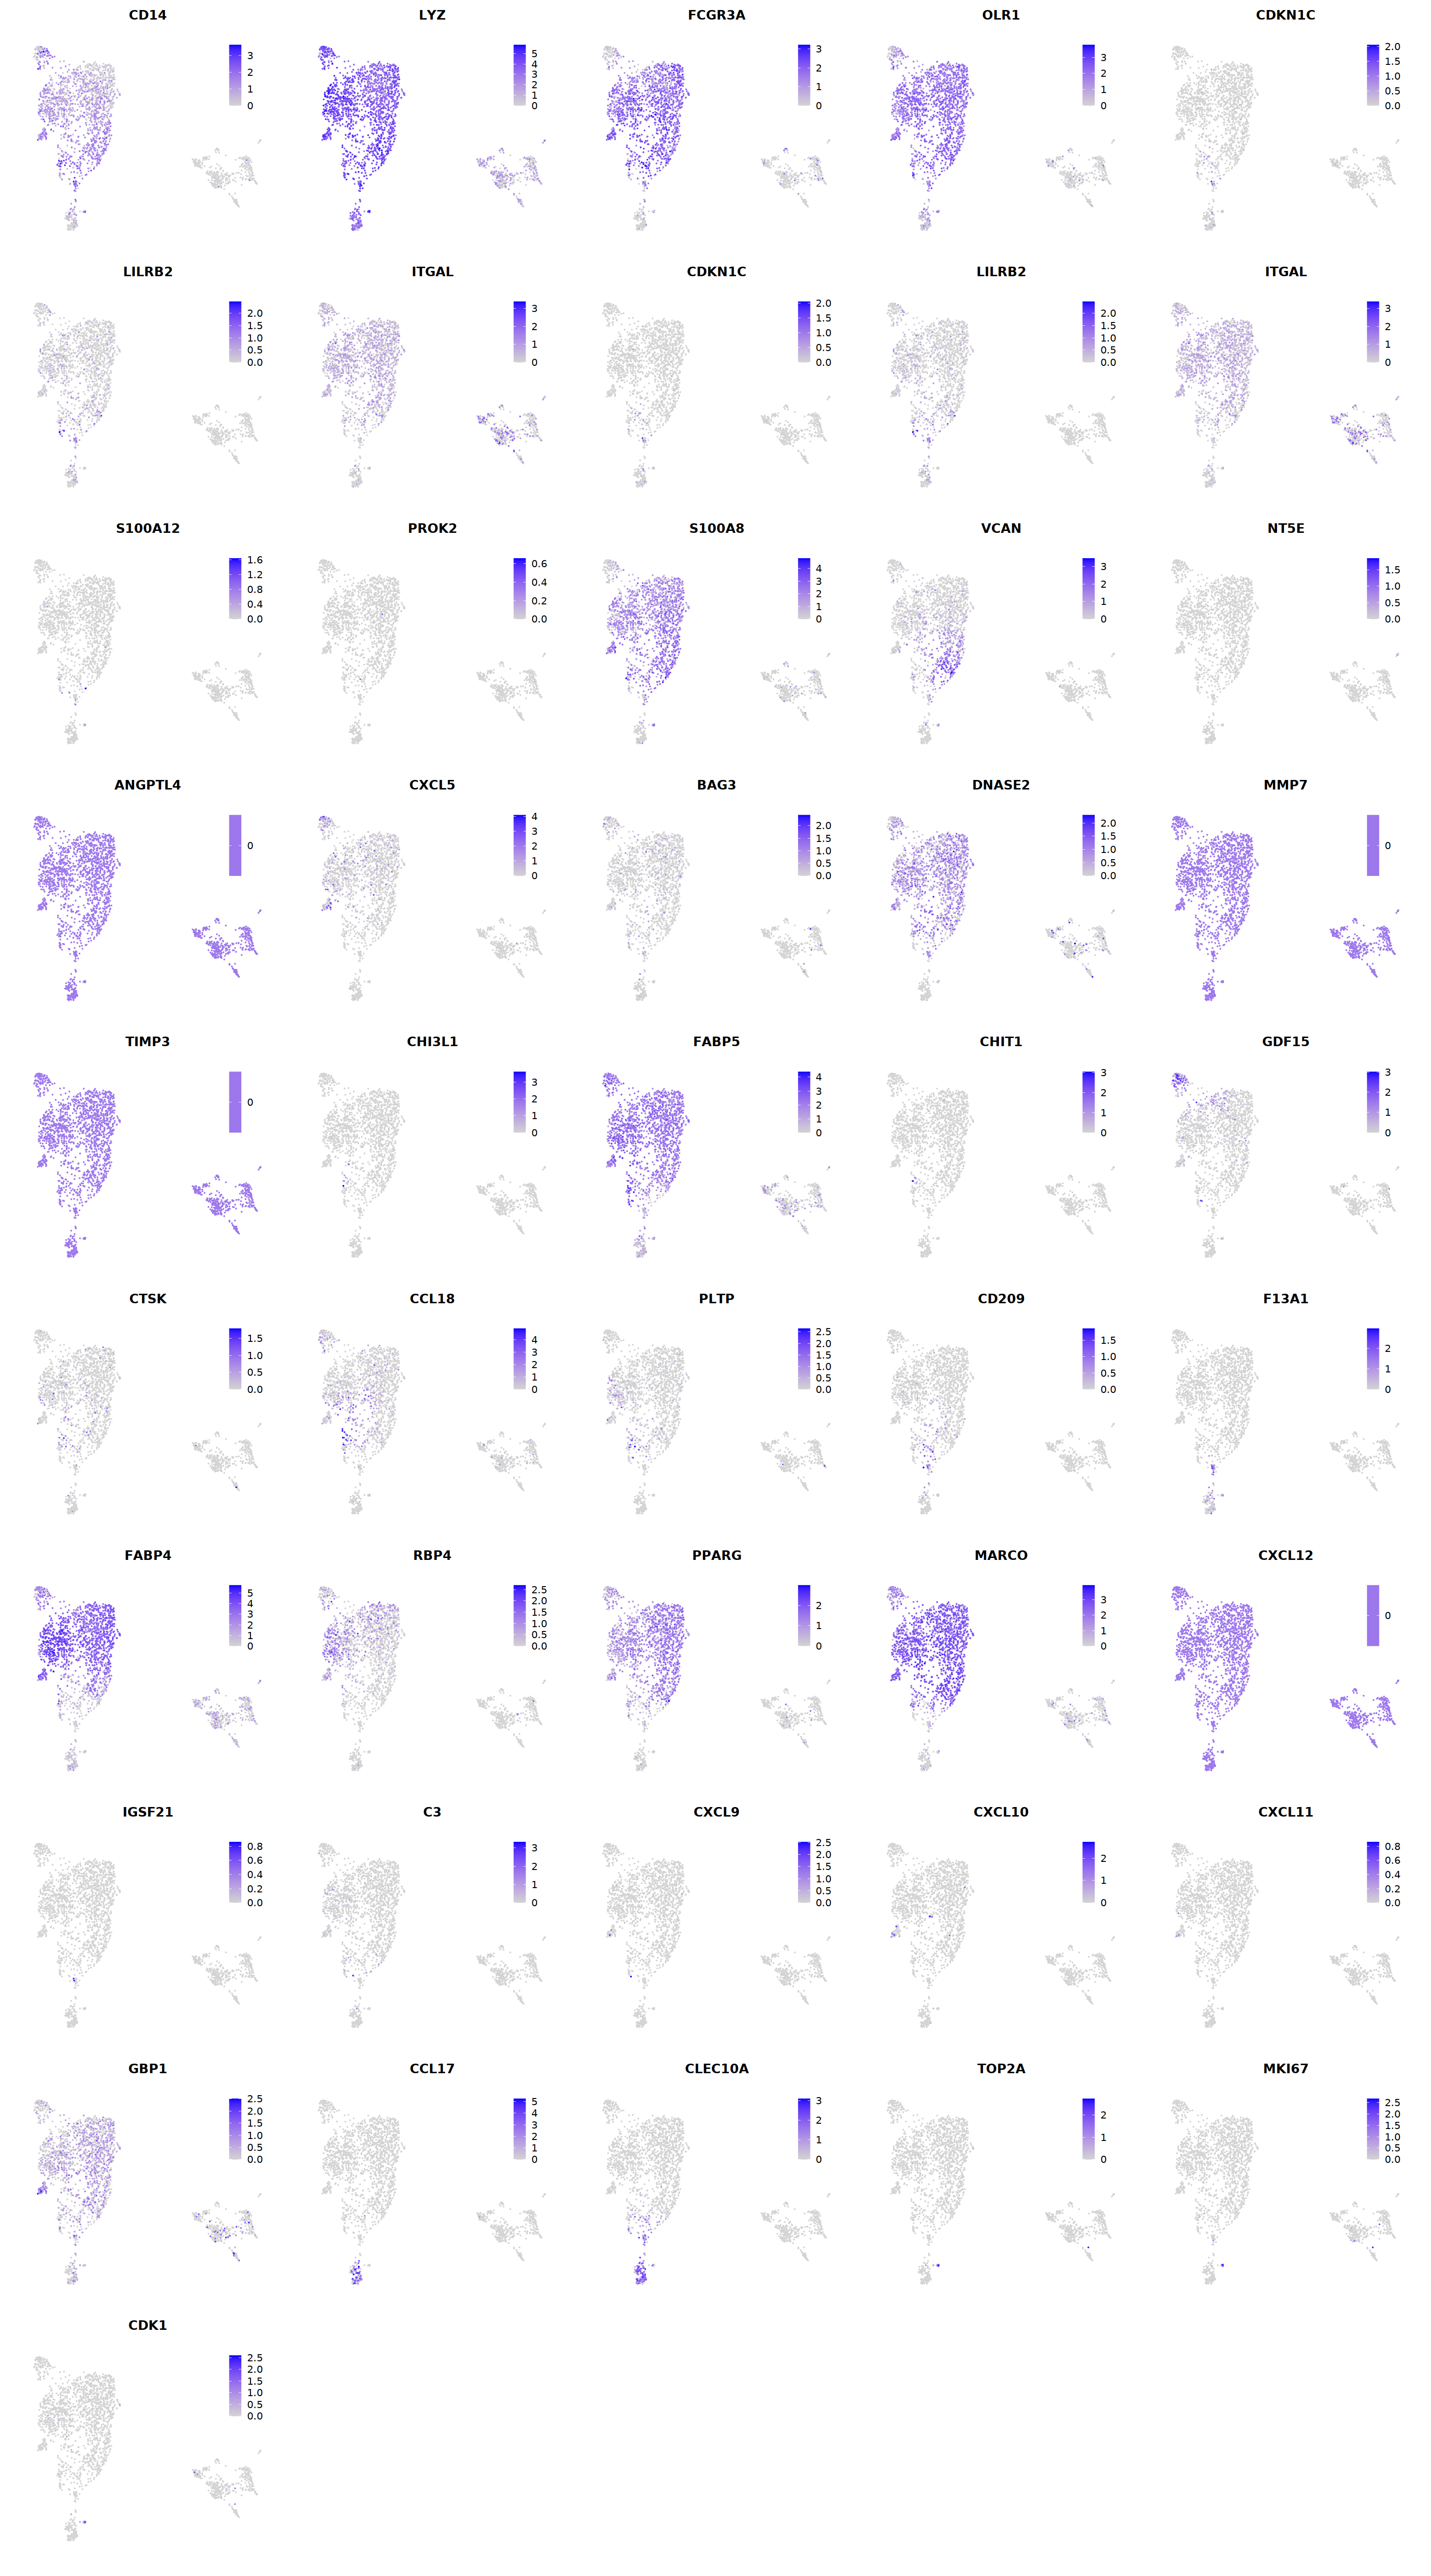
cell.sel = Cells(subset(seu, persample_ann=="Mye"))
seu@meta.data[cell.sel, "persample_ann"] = 'macrophage'

cell.sel = Cells(subset(seu, persample_ann=="T")) # wrong integration
seu@meta.data[cell.sel, "persample_ann"] = 'macrophage'
o(7,7)
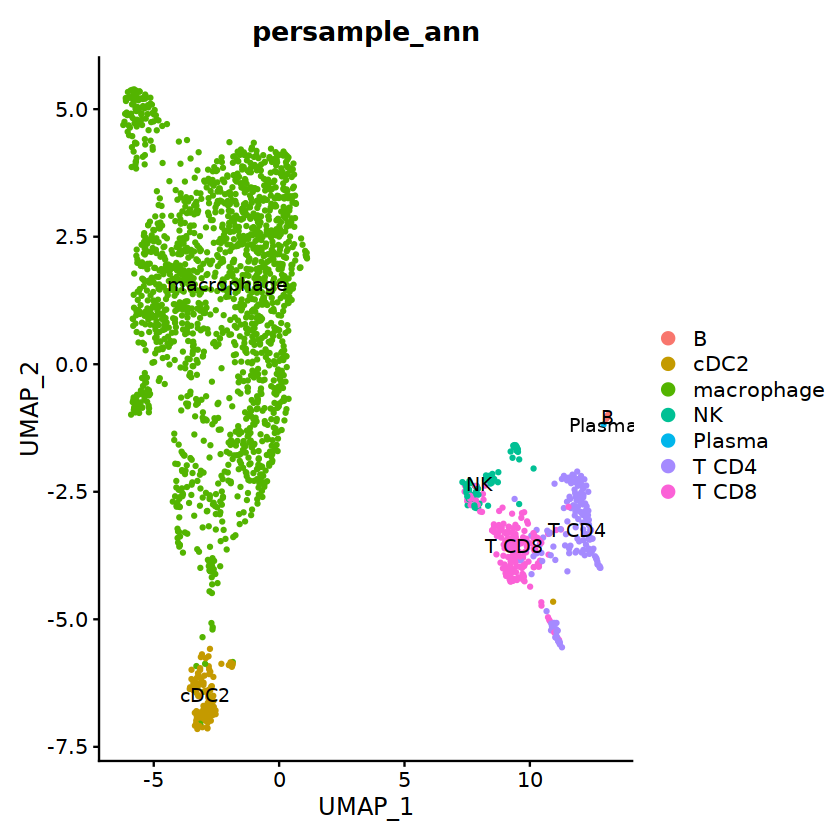
DimPlot(seu, group.by='persample_ann', label=T)
T
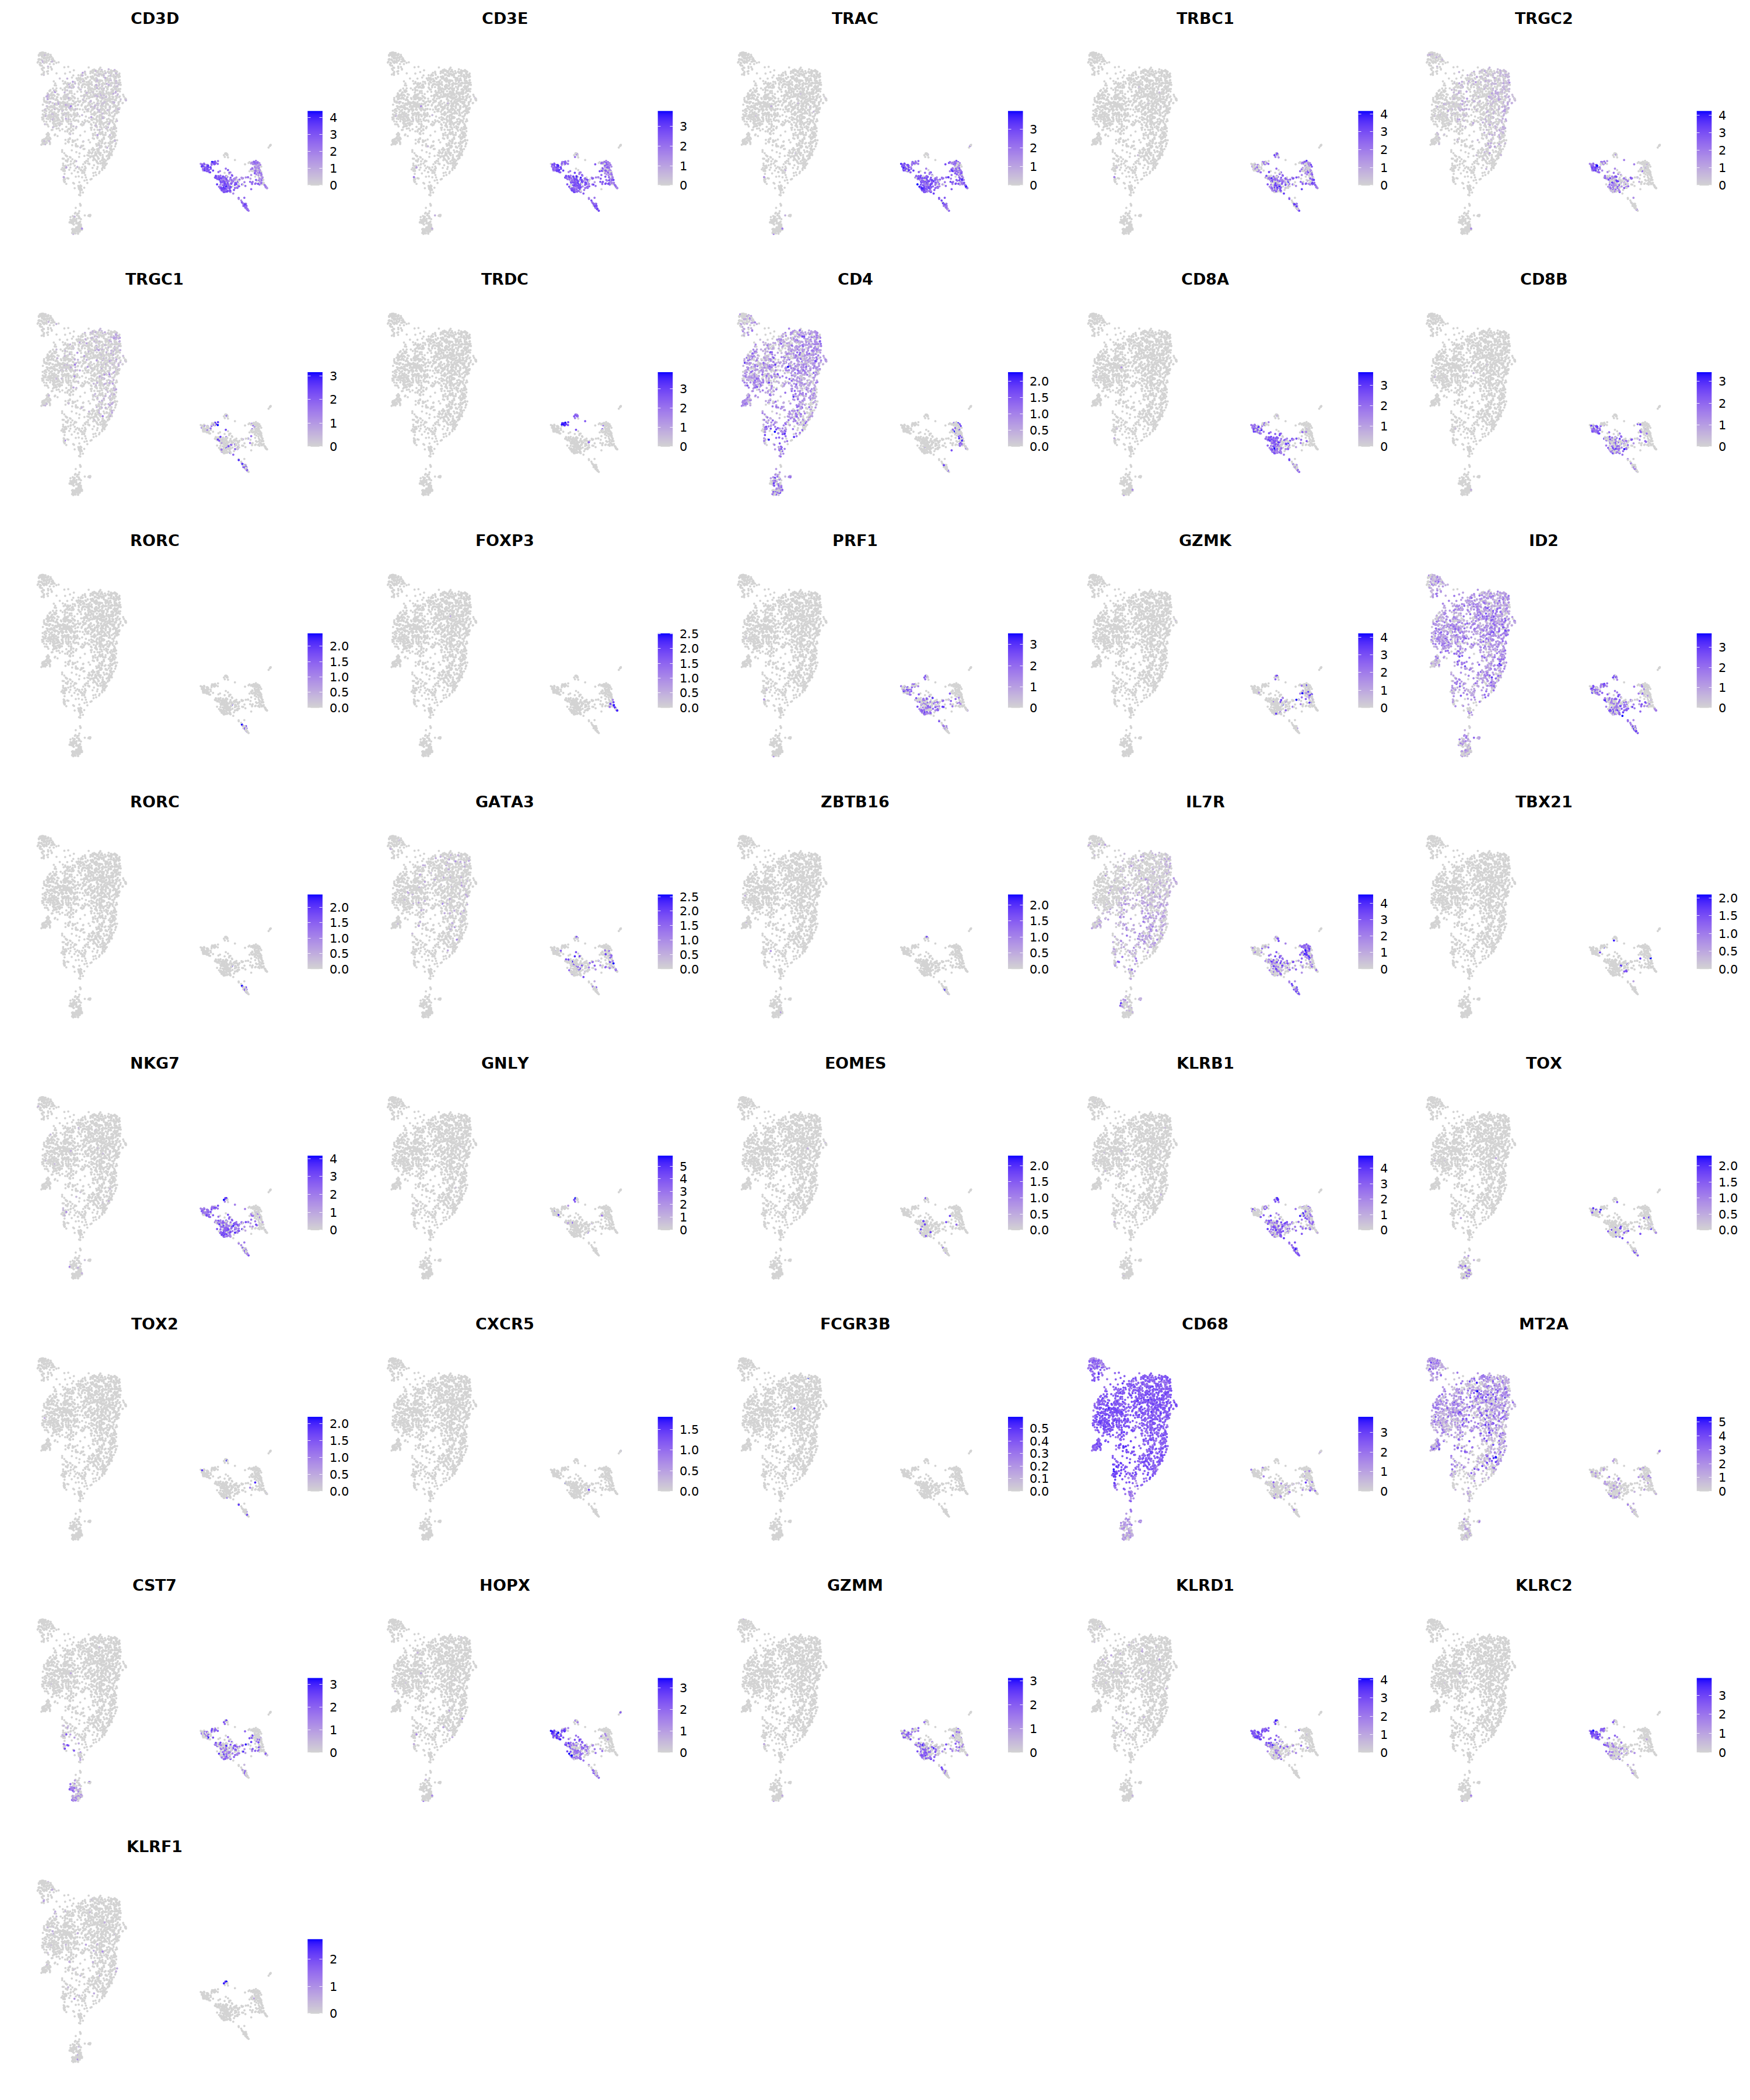
# T cell markers
o(5*5, 5*6)
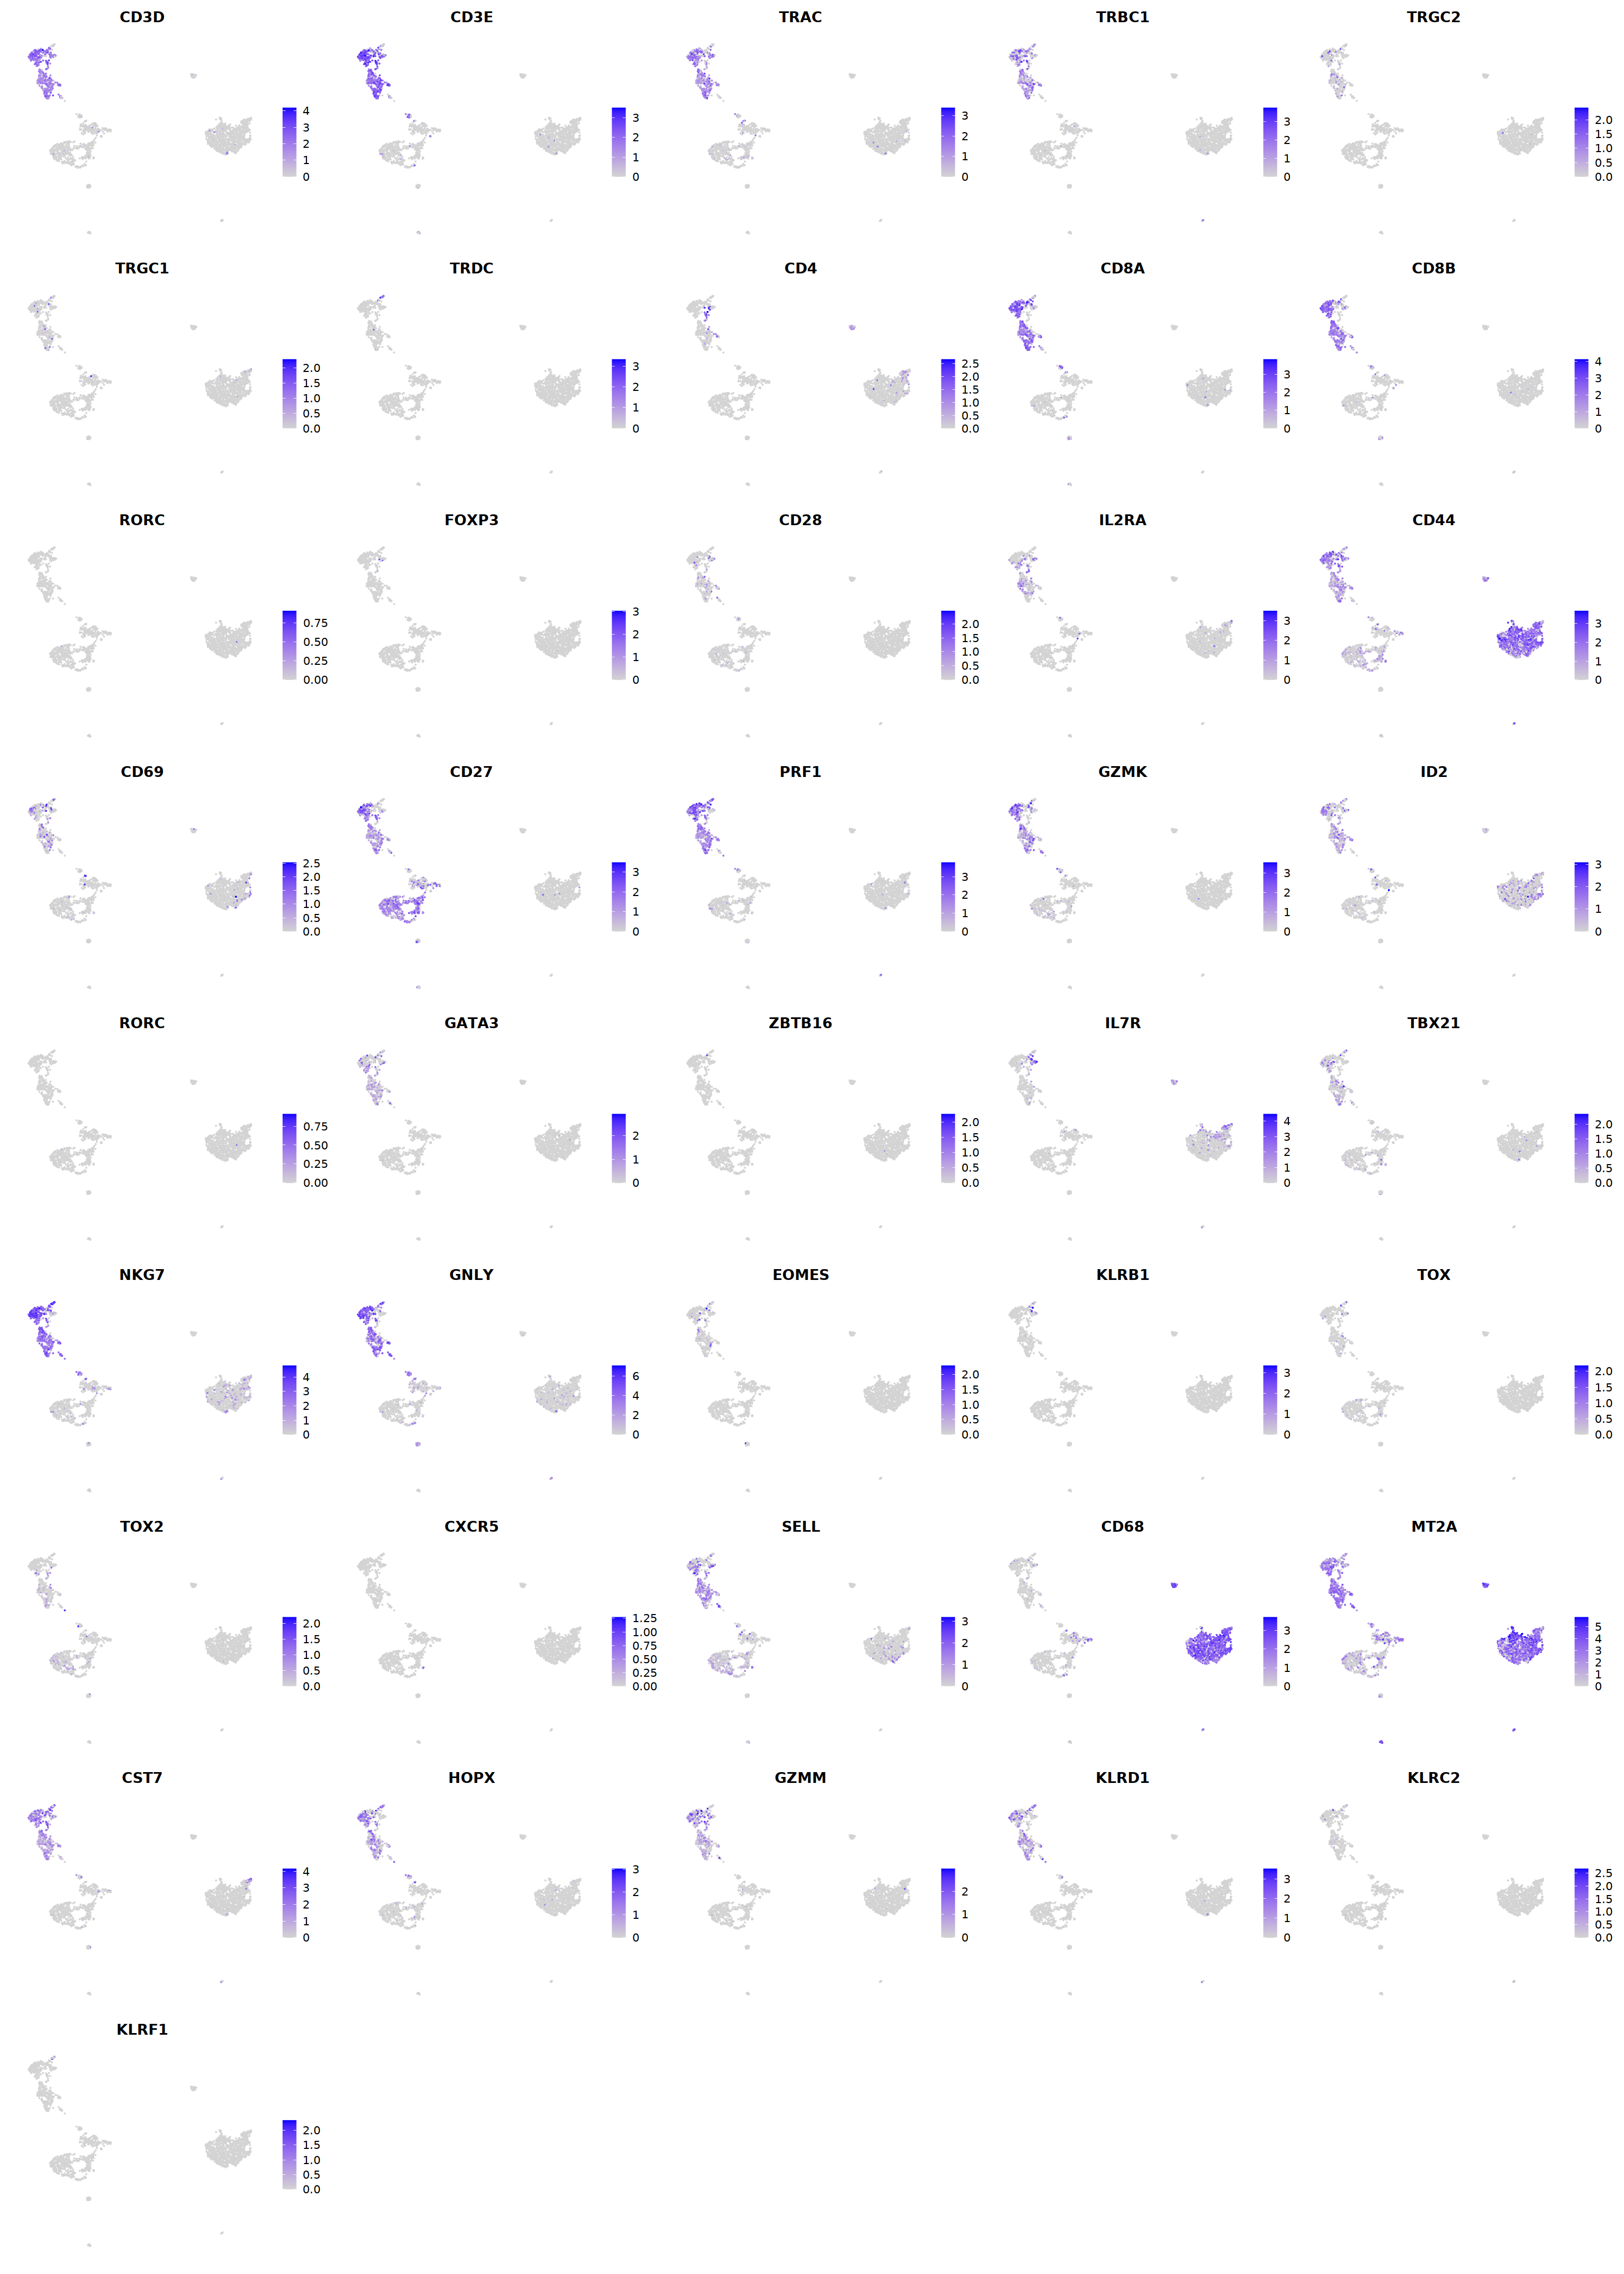
FeaturePlot(seu, ncol = 5,pt.size=0.01,
features = c("CD3D","CD3E",'TRAC','TRBC1','TRGC2','TRGC1','TRDC',
             "CD4",'CD8A','CD8B','RORC','FOXP3',
             'PRF1','GZMK','ID2','RORC','GATA3',
             'ZBTB16','IL7R','TBX21','NKG7','GNLY','EOMES','KLRB1',
             'TOX',"TOX2",'CXCR5','FCGR3B','CD68',
            'MT2A','CST7','HOPX','GZMM','KLRD1','KLRC2','KLRF1'), order=F)&theme(axis.line = element_blank(),
axis.title = element_blank(),axis.text = element_blank(), axis.ticks=element_blank()
)
seu = FindSubCluster(seu, cluster="8",
                      graph.name="RNA_snn",
                      subcluster.name = "RNA_snn_res.0.7",  resolution = 1, algorithm = 1)
Modularity Optimizer version 1.3.0 by Ludo Waltman and Nees Jan van Eck

Number of nodes: 80
Number of edges: 1953

Running Louvain algorithm...
Maximum modularity in 10 random starts: 0.2591
Number of communities: 3
Elapsed time: 0 seconds
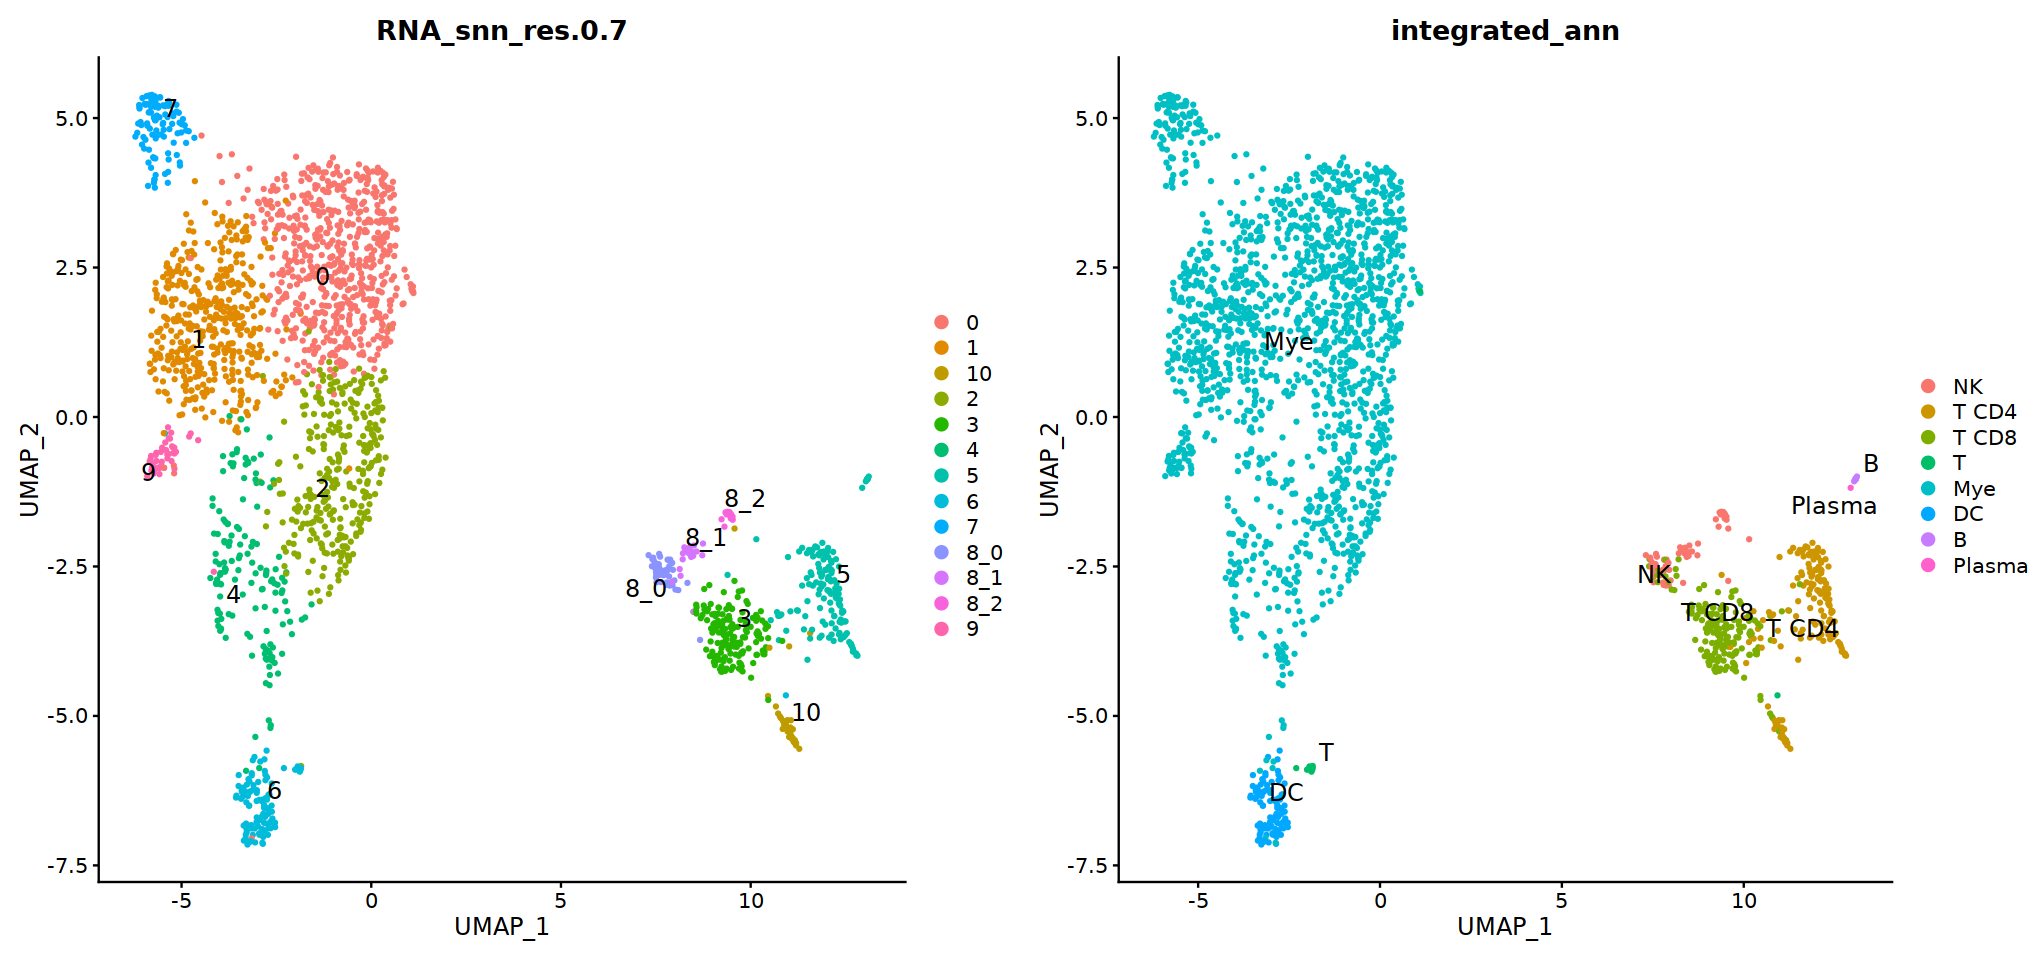
group.by= 'RNA_snn_res.0.7'

o(17,8)
ggarrange(
    DimPlot(seu, group.by=group.by, label=T,repel=T, label.size = 5),
    DimPlot(seu, group.by='integrated_ann',  label=T,repel=T, label.size = 5),
    nrow=1, ncol=2
)
cell.sel = Cells(subset(seu, RNA_snn_res.0.7=='8_2'))
seu@meta.data[cell.sel, "persample_ann"] = 'NK'

cell.sel = Cells(subset(seu, RNA_snn_res.0.7=='8_1'))
seu@meta.data[cell.sel, "persample_ann"] = 'gdT'

cell.sel = Cells(subset(seu, RNA_snn_res.0.7=='8_0'))
seu@meta.data[cell.sel, "persample_ann"] = 'CD8 cytotoxic T'

cell.sel = Cells(subset(seu, RNA_snn_res.0.7=='10'))
seu@meta.data[cell.sel, "persample_ann"] = 'NKT'
o(6,6)
DimPlot(seu, group.by='persample_ann', label=T)

sample_name
seu -> immune.list[[sample_name]]
Idents(seu) <- group.by
deg = FindMarkers(seu,assay='RNA',slot='data',only.pos=T, ident.1='8_1')
deg
| p_val | avg_log2FC | pct.1 | pct.2 | p_val_adj | |
|---|---|---|---|---|---|
| <dbl> | <dbl> | <dbl> | <dbl> | <dbl> | |
| TRDC | 1.839313e-109 | 4.1295933 | 0.647 | 0.009 | 4.398902e-105 |
| KRT81 | 3.658862e-50 | 1.2960927 | 0.235 | 0.002 | 8.750534e-46 |
| KLRD1 | 3.983541e-43 | 3.1243187 | 0.941 | 0.071 | 9.527036e-39 |
| KLRC2 | 3.357422e-39 | 2.8224503 | 0.765 | 0.049 | 8.029610e-35 |
| CD7 | 2.278602e-31 | 2.8785861 | 1.000 | 0.111 | 5.449504e-27 |
| XCL1 | 1.751611e-30 | 2.0597460 | 0.353 | 0.013 | 4.189152e-26 |
| ZNF683 | 1.425206e-25 | 1.6874249 | 0.647 | 0.052 | 3.408522e-21 |
| HOPX | 2.550239e-25 | 2.3662259 | 0.824 | 0.091 | 6.099152e-21 |
| LINC01871 | 2.664493e-25 | 2.0419794 | 0.765 | 0.076 | 6.372401e-21 |
| KLRC1 | 6.528127e-24 | 2.9617089 | 0.765 | 0.086 | 1.561267e-19 |
| CCL5 | 7.207062e-24 | 3.3177114 | 1.000 | 0.163 | 1.723641e-19 |
| XCL2 | 6.118473e-22 | 1.7672923 | 0.471 | 0.033 | 1.463294e-17 |
| NKG7 | 1.475598e-20 | 2.3361771 | 0.824 | 0.112 | 3.529039e-16 |
| CD2 | 4.783042e-19 | 2.1088532 | 1.000 | 0.171 | 1.143912e-14 |
| GZMA | 1.605923e-18 | 2.5984064 | 0.765 | 0.107 | 3.840726e-14 |
| CD3E | 2.032856e-18 | 2.1512633 | 0.941 | 0.162 | 4.861779e-14 |
| KLRC4 | 2.782834e-18 | 1.1513141 | 0.294 | 0.015 | 6.655426e-14 |
| CCL4 | 2.310507e-17 | 2.4048140 | 0.706 | 0.093 | 5.525808e-13 |
| DMTN | 2.349652e-17 | 0.7786861 | 0.176 | 0.006 | 5.619427e-13 |
| TRBC2 | 4.118310e-17 | 2.2146072 | 0.824 | 0.133 | 9.849350e-13 |
| AL109955.1 | 6.570097e-17 | 0.5574824 | 0.118 | 0.002 | 1.571304e-12 |
| ZNF853 | 8.032495e-17 | 0.5715661 | 0.118 | 0.002 | 1.921051e-12 |
| CD3D | 9.561515e-17 | 2.7284445 | 1.000 | 0.253 | 2.286732e-12 |
| IL32 | 1.050927e-16 | 2.2238271 | 0.941 | 0.171 | 2.513396e-12 |
| CD3G | 1.203798e-16 | 2.3774526 | 0.941 | 0.199 | 2.879004e-12 |
| CD96 | 1.813760e-16 | 1.7434339 | 0.588 | 0.069 | 4.337790e-12 |
| IKZF3 | 1.814254e-16 | 1.6626639 | 0.647 | 0.083 | 4.338970e-12 |
| GZMB | 2.127995e-16 | 1.9307053 | 0.588 | 0.068 | 5.089312e-12 |
| GZMH | 2.474445e-16 | 1.2821400 | 0.412 | 0.033 | 5.917883e-12 |
| CXCR3 | 7.771255e-16 | 1.7552947 | 0.471 | 0.047 | 1.858573e-11 |
| ⋮ | ⋮ | ⋮ | ⋮ | ⋮ | ⋮ |
| AKT1 | 0.9888736 | 0.5684879 | 0.235 | 0.299 | 1 |
| MRPS22 | 0.9889726 | 0.5766257 | 0.176 | 0.215 | 1 |
| PRPF31 | 0.9891048 | 0.5289935 | 0.235 | 0.302 | 1 |
| PRPF38A | 0.9893231 | 0.6783254 | 0.235 | 0.305 | 1 |
| CEBPZOS | 0.9897172 | 0.6230246 | 0.294 | 0.410 | 1 |
| PHF11 | 0.9907343 | 0.7765831 | 0.294 | 0.405 | 1 |
| MNAT1 | 0.9909854 | 0.5886325 | 0.118 | 0.131 | 1 |
| SH3BP1 | 0.9927957 | 0.6031309 | 0.294 | 0.398 | 1 |
| NOP14 | 0.9931480 | 0.4647051 | 0.118 | 0.133 | 1 |
| KDM4C | 0.9932802 | 0.6076111 | 0.176 | 0.213 | 1 |
| CCDC126 | 0.9947133 | 0.3889598 | 0.118 | 0.132 | 1 |
| HCFC2 | 0.9947450 | 0.5232409 | 0.118 | 0.133 | 1 |
| PHC3 | 0.9961317 | 0.6084683 | 0.294 | 0.397 | 1 |
| ZNF655 | 0.9963818 | 0.6429529 | 0.353 | 0.524 | 1 |
| TMEM181 | 0.9967292 | 0.5148573 | 0.176 | 0.210 | 1 |
| RNGTT | 0.9968375 | 0.4348130 | 0.118 | 0.133 | 1 |
| PET117 | 0.9968375 | 0.3814286 | 0.118 | 0.133 | 1 |
| TMEM267 | 0.9970879 | 0.3752158 | 0.118 | 0.131 | 1 |
| MYCBP | 0.9976115 | 0.6060258 | 0.176 | 0.213 | 1 |
| DDX27 | 0.9978952 | 0.7470943 | 0.235 | 0.301 | 1 |
| MRPL48 | 0.9980375 | 0.4903577 | 0.176 | 0.210 | 1 |
| FAM3A | 0.9980425 | 0.5111415 | 0.176 | 0.212 | 1 |
| SPN | 0.9984396 | 0.9234662 | 0.471 | 0.786 | 1 |
| SEPT9 | 0.9988471 | 0.9624608 | 0.353 | 0.520 | 1 |
| ZC3H18 | 0.9989079 | 0.4891898 | 0.176 | 0.209 | 1 |
| GLIPR1 | 0.9992160 | 0.2737284 | 0.471 | 0.732 | 1 |
| SBF1 | 0.9997345 | 0.3260796 | 0.118 | 0.130 | 1 |
| ZNF605 | 0.9997361 | 0.3475913 | 0.118 | 0.132 | 1 |
| NOP58 | 0.9998075 | 0.5486683 | 0.235 | 0.296 | 1 |
| FOXJ3 | 1.0000000 | 0.5595441 | 0.176 | 0.213 | 1 |
deg%>% filter(pct.1>0.5)%>% arrange(desc(avg_log2FC))
| p_val | avg_log2FC | pct.1 | pct.2 | p_val_adj | |
|---|---|---|---|---|---|
| <dbl> | <dbl> | <dbl> | <dbl> | <dbl> | |
| RNASE1 | 7.587222e-91 | 2.491213 | 0.504 | 0.042 | 1.814560e-86 |
| MARCKS | 4.348613e-124 | 2.447883 | 0.854 | 0.111 | 1.040014e-119 |
| CTSB | 3.472279e-48 | 1.970851 | 0.992 | 0.809 | 8.304303e-44 |
| FPR3 | 1.038331e-64 | 1.872209 | 0.951 | 0.428 | 2.483273e-60 |
| C15orf48 | 1.971680e-08 | 1.856268 | 0.659 | 0.518 | 4.715470e-04 |
| LGMN | 1.839163e-55 | 1.776968 | 0.593 | 0.124 | 4.398543e-51 |
| CTSL | 1.655449e-05 | 1.750685 | 0.772 | 0.711 | 3.959173e-01 |
| SOD2 | 6.726376e-11 | 1.708385 | 0.642 | 0.432 | 1.608680e-06 |
| A2M | 1.530249e-55 | 1.704284 | 0.797 | 0.266 | 3.659743e-51 |
| SGK1 | 1.060017e-27 | 1.627734 | 0.805 | 0.495 | 2.535138e-23 |
| MS4A6A | 4.294375e-29 | 1.625772 | 0.813 | 0.490 | 1.027043e-24 |
| MAFB | 3.133365e-51 | 1.602417 | 0.854 | 0.358 | 7.493756e-47 |
| TIMP1 | 2.238040e-08 | 1.595311 | 0.764 | 0.664 | 5.352497e-04 |
| FGL2 | 3.458207e-46 | 1.562322 | 0.724 | 0.217 | 8.270648e-42 |
| TMEM176B | 5.851589e-77 | 1.475876 | 0.756 | 0.145 | 1.399466e-72 |
| PMP22 | 1.056506e-81 | 1.472176 | 0.789 | 0.160 | 2.526741e-77 |
| ZFP36L1 | 6.775244e-36 | 1.413937 | 0.894 | 0.468 | 1.620367e-31 |
| LGALS1 | 2.060088e-42 | 1.375154 | 1.000 | 0.878 | 4.926908e-38 |
| CD14 | 2.474328e-24 | 1.357116 | 0.854 | 0.601 | 5.917602e-20 |
| GPNMB | 3.849302e-14 | 1.355089 | 0.902 | 0.757 | 9.205992e-10 |
| NPC2 | 6.904184e-44 | 1.347347 | 1.000 | 0.824 | 1.651205e-39 |
| NEAT1 | 5.164746e-28 | 1.343176 | 0.984 | 0.940 | 1.235201e-23 |
| CSF1R | 2.139745e-33 | 1.308603 | 0.821 | 0.455 | 5.117413e-29 |
| TMEM176A | 3.710693e-88 | 1.307035 | 0.675 | 0.091 | 8.874495e-84 |
| HIF1A | 3.266683e-30 | 1.276133 | 0.732 | 0.348 | 7.812600e-26 |
| TYMP | 9.253753e-39 | 1.258439 | 1.000 | 0.853 | 2.213128e-34 |
| TGFBI | 1.700822e-29 | 1.205918 | 0.854 | 0.575 | 4.067687e-25 |
| IER3 | 1.613880e-35 | 1.202232 | 0.593 | 0.174 | 3.859755e-31 |
| PLA2G7 | 1.456169e-64 | 1.151234 | 0.520 | 0.074 | 3.482574e-60 |
| KCTD12 | 8.749512e-32 | 1.141522 | 0.927 | 0.682 | 2.092533e-27 |
| ⋮ | ⋮ | ⋮ | ⋮ | ⋮ | ⋮ |
| UPP1 | 7.613135e-03 | 0.2645307 | 0.789 | 0.723 | 1.0000000000 |
| HLA-E | 4.844946e-07 | 0.2643889 | 0.984 | 0.961 | 0.0115871728 |
| RPS6KA3 | 7.482350e-06 | 0.2638820 | 0.667 | 0.527 | 0.1789478818 |
| HCLS1 | 2.542558e-05 | 0.2636697 | 0.797 | 0.711 | 0.6080780865 |
| HSPA1B | 3.568896e-02 | 0.2626966 | 0.512 | 0.427 | 1.0000000000 |
| CTNNB1 | 8.606003e-02 | 0.2618024 | 0.870 | 0.792 | 1.0000000000 |
| FYB1 | 1.447037e-08 | 0.2615420 | 0.837 | 0.717 | 0.0003460734 |
| FAM120A | 5.301785e-04 | 0.2605718 | 0.707 | 0.665 | 1.0000000000 |
| ATP6V0D1 | 7.257155e-03 | 0.2590507 | 0.870 | 0.785 | 1.0000000000 |
| LRP1 | 6.550845e-03 | 0.2586537 | 0.772 | 0.710 | 1.0000000000 |
| PIK3AP1 | 1.906010e-03 | 0.2574911 | 0.569 | 0.498 | 1.0000000000 |
| SCAMP2 | 3.942718e-03 | 0.2572498 | 0.602 | 0.561 | 1.0000000000 |
| NDFIP1 | 4.934907e-05 | 0.2571515 | 0.780 | 0.684 | 1.0000000000 |
| SRGN | 4.258241e-01 | 0.2558926 | 0.992 | 0.936 | 1.0000000000 |
| AZIN1 | 1.115899e-04 | 0.2558483 | 0.561 | 0.446 | 1.0000000000 |
| C5AR1 | 1.082796e-01 | 0.2555327 | 0.602 | 0.607 | 1.0000000000 |
| TMBIM1 | 1.029257e-03 | 0.2554895 | 0.577 | 0.488 | 1.0000000000 |
| SERINC1 | 2.605987e-03 | 0.2554693 | 0.780 | 0.709 | 1.0000000000 |
| GRK2 | 6.228355e-04 | 0.2539199 | 0.683 | 0.588 | 1.0000000000 |
| RASGEF1B | 4.858185e-02 | 0.2538285 | 0.659 | 0.615 | 1.0000000000 |
| NONO | 3.257847e-04 | 0.2536114 | 0.675 | 0.590 | 1.0000000000 |
| PRKAR1A | 2.256688e-04 | 0.2529733 | 0.805 | 0.727 | 1.0000000000 |
| COTL1 | 2.218551e-02 | 0.2527823 | 0.951 | 0.870 | 1.0000000000 |
| PTPN2 | 2.038384e-05 | 0.2522980 | 0.593 | 0.458 | 0.4875000367 |
| WASHC4 | 2.959135e-04 | 0.2516360 | 0.724 | 0.633 | 1.0000000000 |
| IVNS1ABP | 2.111707e-01 | 0.2509298 | 0.577 | 0.573 | 1.0000000000 |
| PRDX3 | 1.373105e-04 | 0.2507781 | 0.740 | 0.677 | 1.0000000000 |
| NUFIP2 | 1.795124e-03 | 0.2502961 | 0.683 | 0.628 | 1.0000000000 |
| PSMD1 | 2.037263e-03 | 0.2501861 | 0.520 | 0.445 | 1.0000000000 |
| SLC31A2 | 4.177946e-03 | 0.2500336 | 0.602 | 0.546 | 1.0000000000 |
HC4
# context switching
sample_name='HC4'

seu= immune.list[[sample_name]]
group.by= 'RNA_snn_res.0.9'

Idents(seu)<-group.by
seu= FindSubCluster(seu, cluster="4",
                      graph.name="RNA_snn",
                      subcluster.name = "RNA_snn_res.0.9",  resolution = 0.5, algorithm = 1)
Idents(seu)<-group.by
seu=FindSubCluster(seu, cluster='8',
                      graph.name="RNA_snn",
                      subcluster.name = "RNA_snn_res.0.9",  resolution = 0.9, algorithm = 1)
Idents(seu)<-group.by
seu=FindSubCluster(seu, cluster='7',
                      graph.name="RNA_snn",
                      subcluster.name = "RNA_snn_res.0.9",  resolution = 0.9, algorithm = 1)
Idents(seu)<-group.by
seu=FindSubCluster(seu, cluster='5',
                      graph.name="RNA_snn",
                      subcluster.name = "RNA_snn_res.0.9",  resolution = 0.9, algorithm = 1)

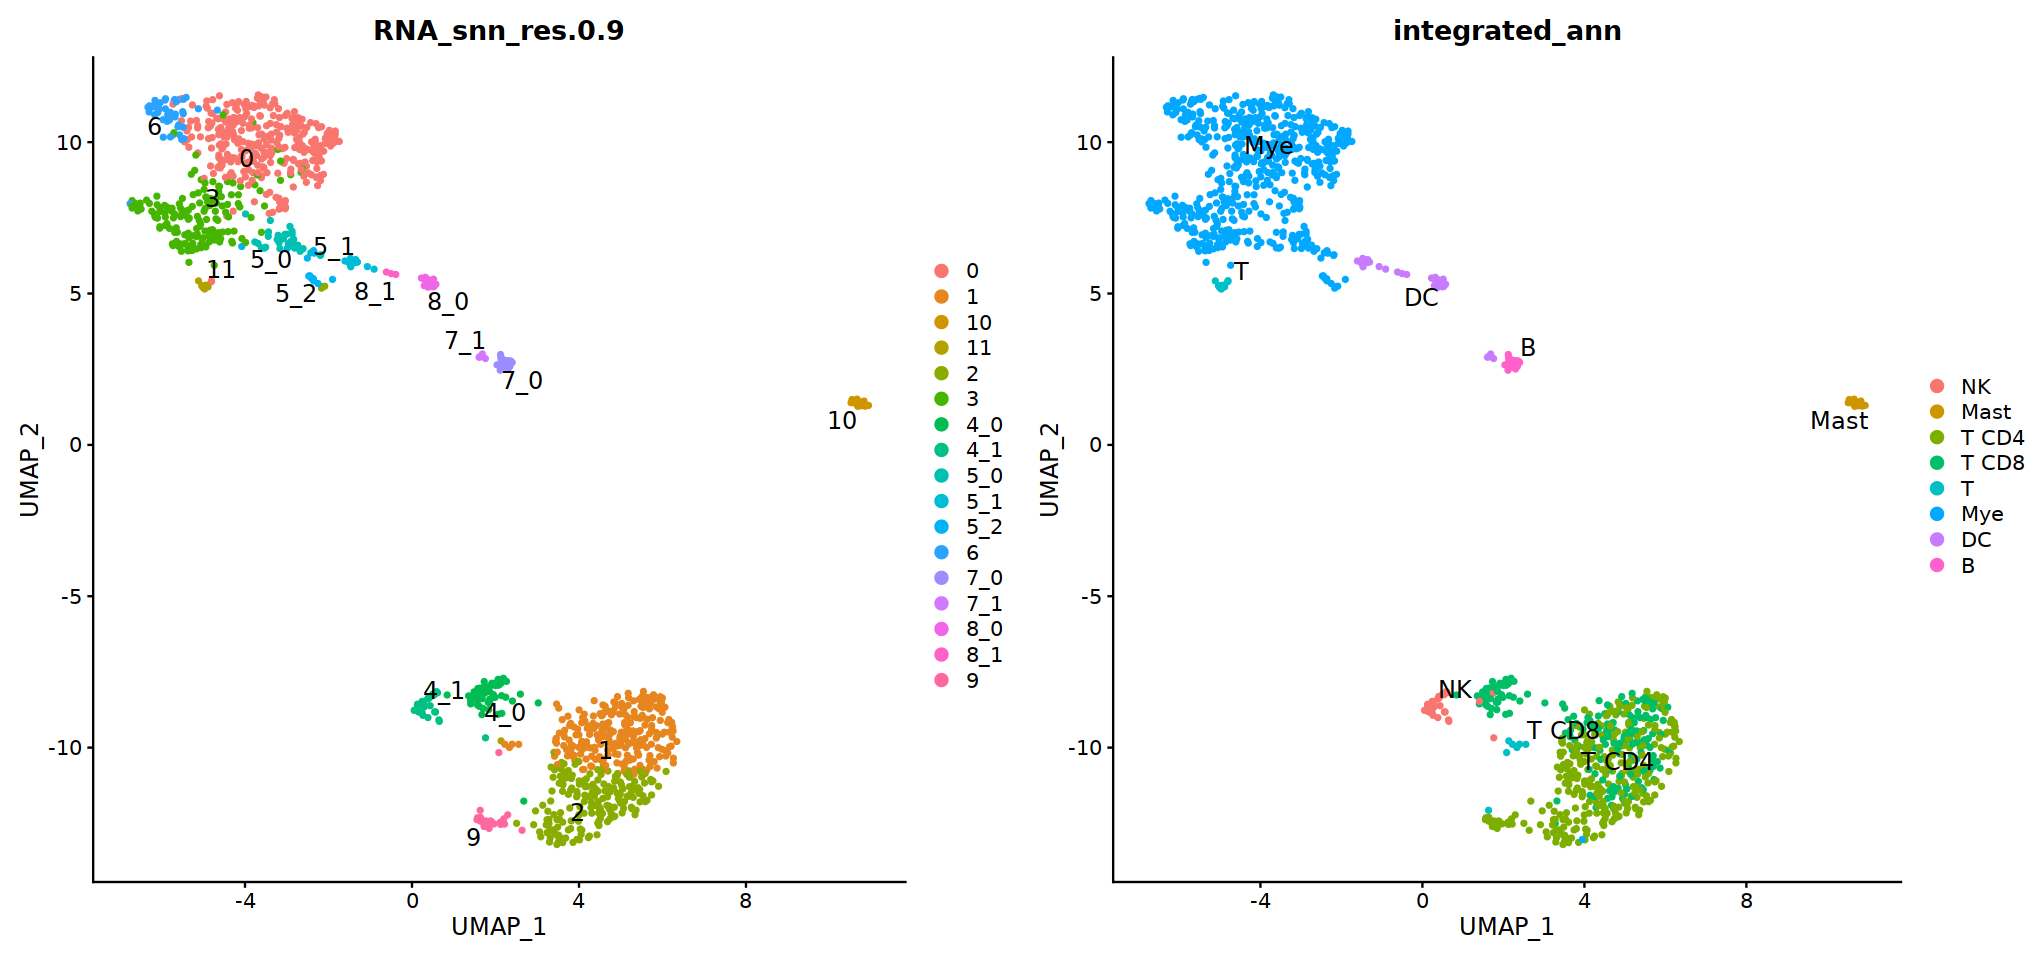
o(17,8)
ggarrange(
    DimPlot(seu, group.by=group.by, label=T,repel=T, label.size = 5),
    DimPlot(seu, group.by='integrated_ann',  label=T,repel=T, label.size = 5),
    nrow=1, ncol=2
)
Modularity Optimizer version 1.3.0 by Ludo Waltman and Nees Jan van Eck

Number of nodes: 79
Number of edges: 1773

Running Louvain algorithm...
Maximum modularity in 10 random starts: 0.6277
Number of communities: 2
Elapsed time: 0 seconds
Modularity Optimizer version 1.3.0 by Ludo Waltman and Nees Jan van Eck

Number of nodes: 25
Number of edges: 300

Running Louvain algorithm...
Maximum modularity in 10 random starts: 0.1113
Number of communities: 2
Elapsed time: 0 seconds
Modularity Optimizer version 1.3.0 by Ludo Waltman and Nees Jan van Eck

Number of nodes: 26
Number of edges: 325

Running Louvain algorithm...
Maximum modularity in 10 random starts: 0.1168
Number of communities: 2
Elapsed time: 0 seconds
Modularity Optimizer version 1.3.0 by Ludo Waltman and Nees Jan van Eck

Number of nodes: 57
Number of edges: 981

Running Louvain algorithm...
Maximum modularity in 10 random starts: 0.3327
Number of communities: 3
Elapsed time: 0 seconds
Idents(seu) <- group.by
deg = FindMarkers(seu,assay='RNA',slot='data',only.pos=T, ident.1='8_1', ident.2='8_0')
deg
| p_val | avg_log2FC | pct.1 | pct.2 | p_val_adj | |
|---|---|---|---|---|---|
| <dbl> | <dbl> | <dbl> | <dbl> | <dbl> | |
| LAMP3 | 1.486080e-06 | 3.3411091 | 1.000 | 0.000 | 0.03554109 |
| CXCL10 | 1.486080e-06 | 2.8406058 | 1.000 | 0.000 | 0.03554109 |
| TMEM131L | 1.486080e-06 | 1.1992254 | 1.000 | 0.000 | 0.03554109 |
| IRF4 | 1.486080e-06 | 1.4480205 | 1.000 | 0.000 | 0.03554109 |
| FSCN1 | 1.486080e-06 | 4.1547505 | 1.000 | 0.000 | 0.03554109 |
| MTSS1 | 1.486080e-06 | 1.8449188 | 1.000 | 0.000 | 0.03554109 |
| NMRK1 | 1.486080e-06 | 1.6601552 | 1.000 | 0.000 | 0.03554109 |
| IL32 | 1.486080e-06 | 3.5070284 | 1.000 | 0.000 | 0.03554109 |
| CCR7 | 1.486080e-06 | 4.9634920 | 1.000 | 0.000 | 0.03554109 |
| MARCKS | 2.076844e-05 | 3.0836309 | 1.000 | 0.045 | 0.49669796 |
| NFKB2 | 2.076844e-05 | 1.6402914 | 1.000 | 0.045 | 0.49669796 |
| TRAFD1 | 2.076844e-05 | 1.8345478 | 1.000 | 0.045 | 0.49669796 |
| TBC1D4 | 2.076844e-05 | 1.8486428 | 1.000 | 0.045 | 0.49669796 |
| MGLL | 3.699350e-05 | 2.3399092 | 1.000 | 0.045 | 0.88473653 |
| TNFRSF1B | 1.007985e-04 | 1.0722802 | 1.000 | 0.091 | 1.00000000 |
| HLX | 1.007985e-04 | 1.6703239 | 1.000 | 0.091 | 1.00000000 |
| COPB2 | 1.007985e-04 | 1.0837500 | 1.000 | 0.091 | 1.00000000 |
| RASSF4 | 1.007985e-04 | 2.3990397 | 1.000 | 0.091 | 1.00000000 |
| IL4I1 | 1.007985e-04 | 2.9857455 | 1.000 | 0.091 | 1.00000000 |
| C22orf39 | 1.007985e-04 | 1.3110923 | 1.000 | 0.091 | 1.00000000 |
| S1PR1 | 1.335349e-04 | 0.8983963 | 0.667 | 0.000 | 1.00000000 |
| LAD1 | 1.335349e-04 | 2.1183957 | 0.667 | 0.000 | 1.00000000 |
| TBC1D8 | 1.335349e-04 | 1.4758641 | 0.667 | 0.000 | 1.00000000 |
| NRP2 | 1.335349e-04 | 1.2643262 | 0.667 | 0.000 | 1.00000000 |
| MREG | 1.335349e-04 | 1.2322501 | 0.667 | 0.000 | 1.00000000 |
| SFMBT1 | 1.335349e-04 | 0.8569252 | 0.667 | 0.000 | 1.00000000 |
| PALLD | 1.335349e-04 | 1.5030030 | 0.667 | 0.000 | 1.00000000 |
| ANKRD33B | 1.335349e-04 | 0.9389710 | 0.667 | 0.000 | 1.00000000 |
| IL7R | 1.335349e-04 | 1.7570257 | 0.667 | 0.000 | 1.00000000 |
| SMIM13 | 1.335349e-04 | 0.8569252 | 0.667 | 0.000 | 1.00000000 |
| ⋮ | ⋮ | ⋮ | ⋮ | ⋮ | ⋮ |
| RTF1 | 0.8077878 | 0.4289912 | 0.333 | 0.364 | 1 |
| GAA | 0.8077878 | 0.2687371 | 0.333 | 0.364 | 1 |
| RTF2 | 0.8077878 | 0.2843369 | 0.333 | 0.364 | 1 |
| PPP1R14A | 0.8077878 | 1.7958909 | 0.333 | 0.364 | 1 |
| ORMDL2 | 0.8289663 | 0.2677090 | 0.333 | 0.636 | 1 |
| MT-ND1 | 0.8344010 | 0.4104578 | 1.000 | 1.000 | 1 |
| PLEK | 0.8649965 | 0.8975389 | 0.667 | 0.682 | 1 |
| CREG1 | 0.8873878 | 0.3553976 | 0.333 | 0.409 | 1 |
| MBNL1 | 0.8873878 | 0.9020871 | 0.333 | 0.409 | 1 |
| TMEM248 | 0.8873878 | 0.3438293 | 0.333 | 0.409 | 1 |
| RAB8B | 0.8873878 | 0.5086880 | 0.333 | 0.409 | 1 |
| TMEM97 | 0.8873878 | 0.5102318 | 0.333 | 0.409 | 1 |
| SERPINA1 | 0.8942233 | 0.3780394 | 0.333 | 0.545 | 1 |
| FLT3 | 0.8956917 | 0.7548489 | 0.333 | 0.591 | 1 |
| LGALS9 | 0.9001017 | 0.3394849 | 1.000 | 0.864 | 1 |
| ANXA2 | 0.9001782 | 0.3246447 | 1.000 | 0.955 | 1 |
| PPDPF | 0.9322545 | 0.8930426 | 0.667 | 0.682 | 1 |
| TFF3 | 0.9623511 | 0.2652216 | 0.333 | 0.409 | 1 |
| GCA | 0.9632835 | 0.4268378 | 0.333 | 0.455 | 1 |
| METTL9 | 0.9632835 | 0.5671898 | 0.333 | 0.455 | 1 |
| FLOT2 | 0.9632835 | 0.2658552 | 0.333 | 0.455 | 1 |
| MPC2 | 0.9646487 | 0.2647332 | 0.333 | 0.545 | 1 |
| FIS1 | 0.9646487 | 0.3608998 | 0.333 | 0.545 | 1 |
| PHPT1 | 0.9646487 | 0.4297490 | 0.333 | 0.545 | 1 |
| SYF2 | 1.0000000 | 0.3420099 | 0.667 | 0.773 | 1 |
| DENND1B | 1.0000000 | 0.3880315 | 0.333 | 0.500 | 1 |
| CAPG | 1.0000000 | 0.8606061 | 0.333 | 0.500 | 1 |
| RAMP1 | 1.0000000 | 1.5697841 | 0.333 | 0.500 | 1 |
| OGFRL1 | 1.0000000 | 0.3737307 | 0.333 | 0.455 | 1 |
| PMPCB | 1.0000000 | 0.6303858 | 0.333 | 0.500 | 1 |
# adopt integrated_ann first
seu@meta.data[, "persample_ann"] = as.character(seu@meta.data[, "integrated_ann"] )
DC
# cDC1
p=Nebulosa::plot_density(seu,c('HLA-DQA1','BATF3','CADM1','CLEC9A','XCR1'),joint=T)&theme(
    axis.title=element_blank(),axis.ticks=element_blank(),axis.text = element_blank())&NoLegend()

o(5*6, 5*1)
p+plot_layout(ncol = 6)

#8_0 is cDC1
#8_1 is also cDC1 (LAMP3+)

cell.sel = Cells(subset(seu, RNA_snn_res.0.9=='8_0'))
seu@meta.data[cell.sel, "persample_ann"] = 'cDC1'


cell.sel = Cells(subset(seu, RNA_snn_res.0.9=='8_1'))
seu@meta.data[cell.sel, "persample_ann"] = 'cDC1'
# cDC2
p=Nebulosa::plot_density(seu,c('CD14','PLD4','CD1C','CX3CR1','CLEC10A'),joint=T)&theme(
    axis.title=element_blank(),axis.ticks=element_blank(),axis.text = element_blank())&NoLegend()

o(5*6, 5*1)
p+plot_layout(ncol = 6)

# pDC
p=Nebulosa::plot_density(seu,c('CLEC4C','IRF4','LILRA4','LILRB4','IRF8'),joint=T)&theme(
    axis.title=element_blank(),axis.ticks=element_blank(),axis.text = element_blank())&NoLegend()

o(5*6, 5*1)
p+plot_layout(ncol = 6)

# 7_1 is pDC

cell.sel = Cells(subset(seu, RNA_snn_res.0.9=='7_1'))
seu@meta.data[cell.sel, "persample_ann"] = 'pDC'
# moDC
p=Nebulosa::plot_density(seu,c('CD14','CD1A','CD1C','FCER1A','CD1E'),joint=T)&theme(
    axis.title=element_blank(),axis.ticks=element_blank(),axis.text = element_blank())&NoLegend()

o(5*6, 5*1)
p+plot_layout(ncol = 6)

# 5_1 is moDC

cell.sel = Cells(subset(seu, RNA_snn_res.0.9=='5_1'))
seu@meta.data[cell.sel, "persample_ann"] = 'moDC'
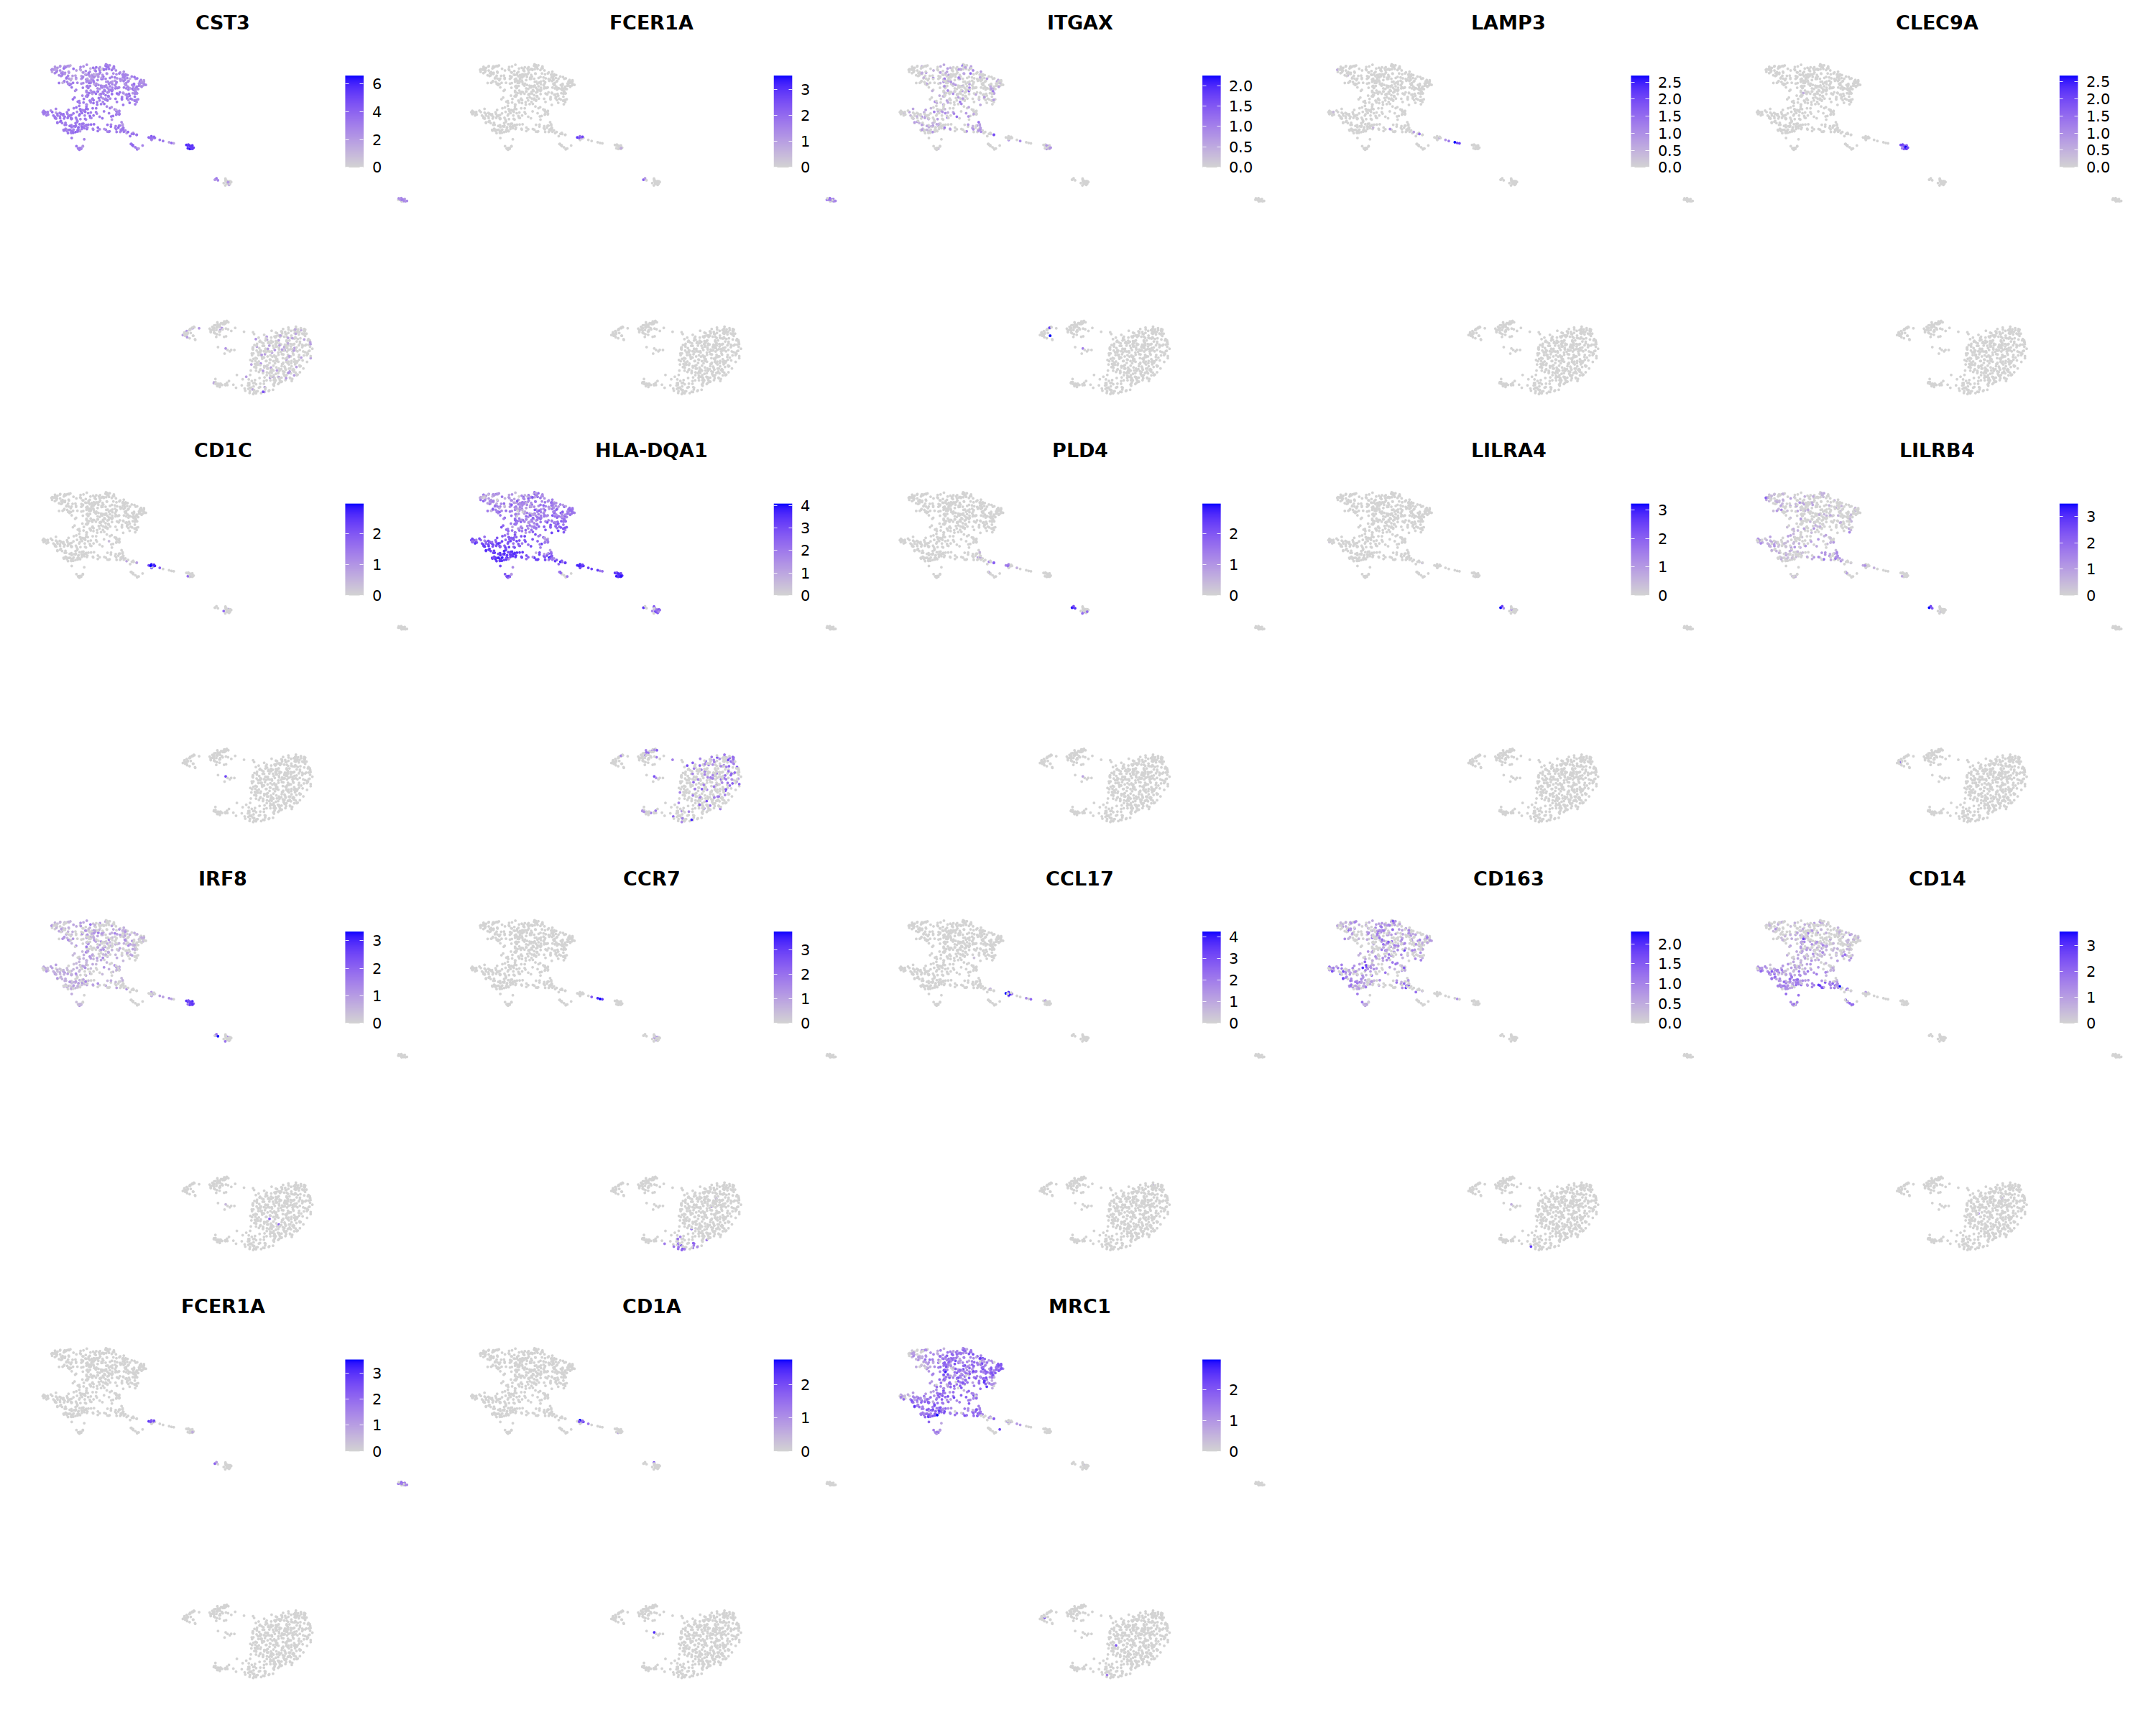
# DC markers
o(5*5, 5*4)
FeaturePlot(seu, ncol = 5,pt.size=0.01,
            features = c('CST3','FCER1A','ITGAX',# pan DC
                         'LAMP3','CLEC9A',#cDC1
                         "CD1C",'HLA-DQA1',"PLD4",# cDC2
                         'LILRA4','LILRB4','IRF8','CCR7', #pDC
                         'CCL17','CD163','CD14','FCER1A','CD1A','MRC1'#moDC
                        )
           )&theme(
legend.position=c(0.8,0.8),
axis.line = element_blank(),
axis.title = element_blank(),axis.text = element_blank(), axis.ticks=element_blank()
)
Mac
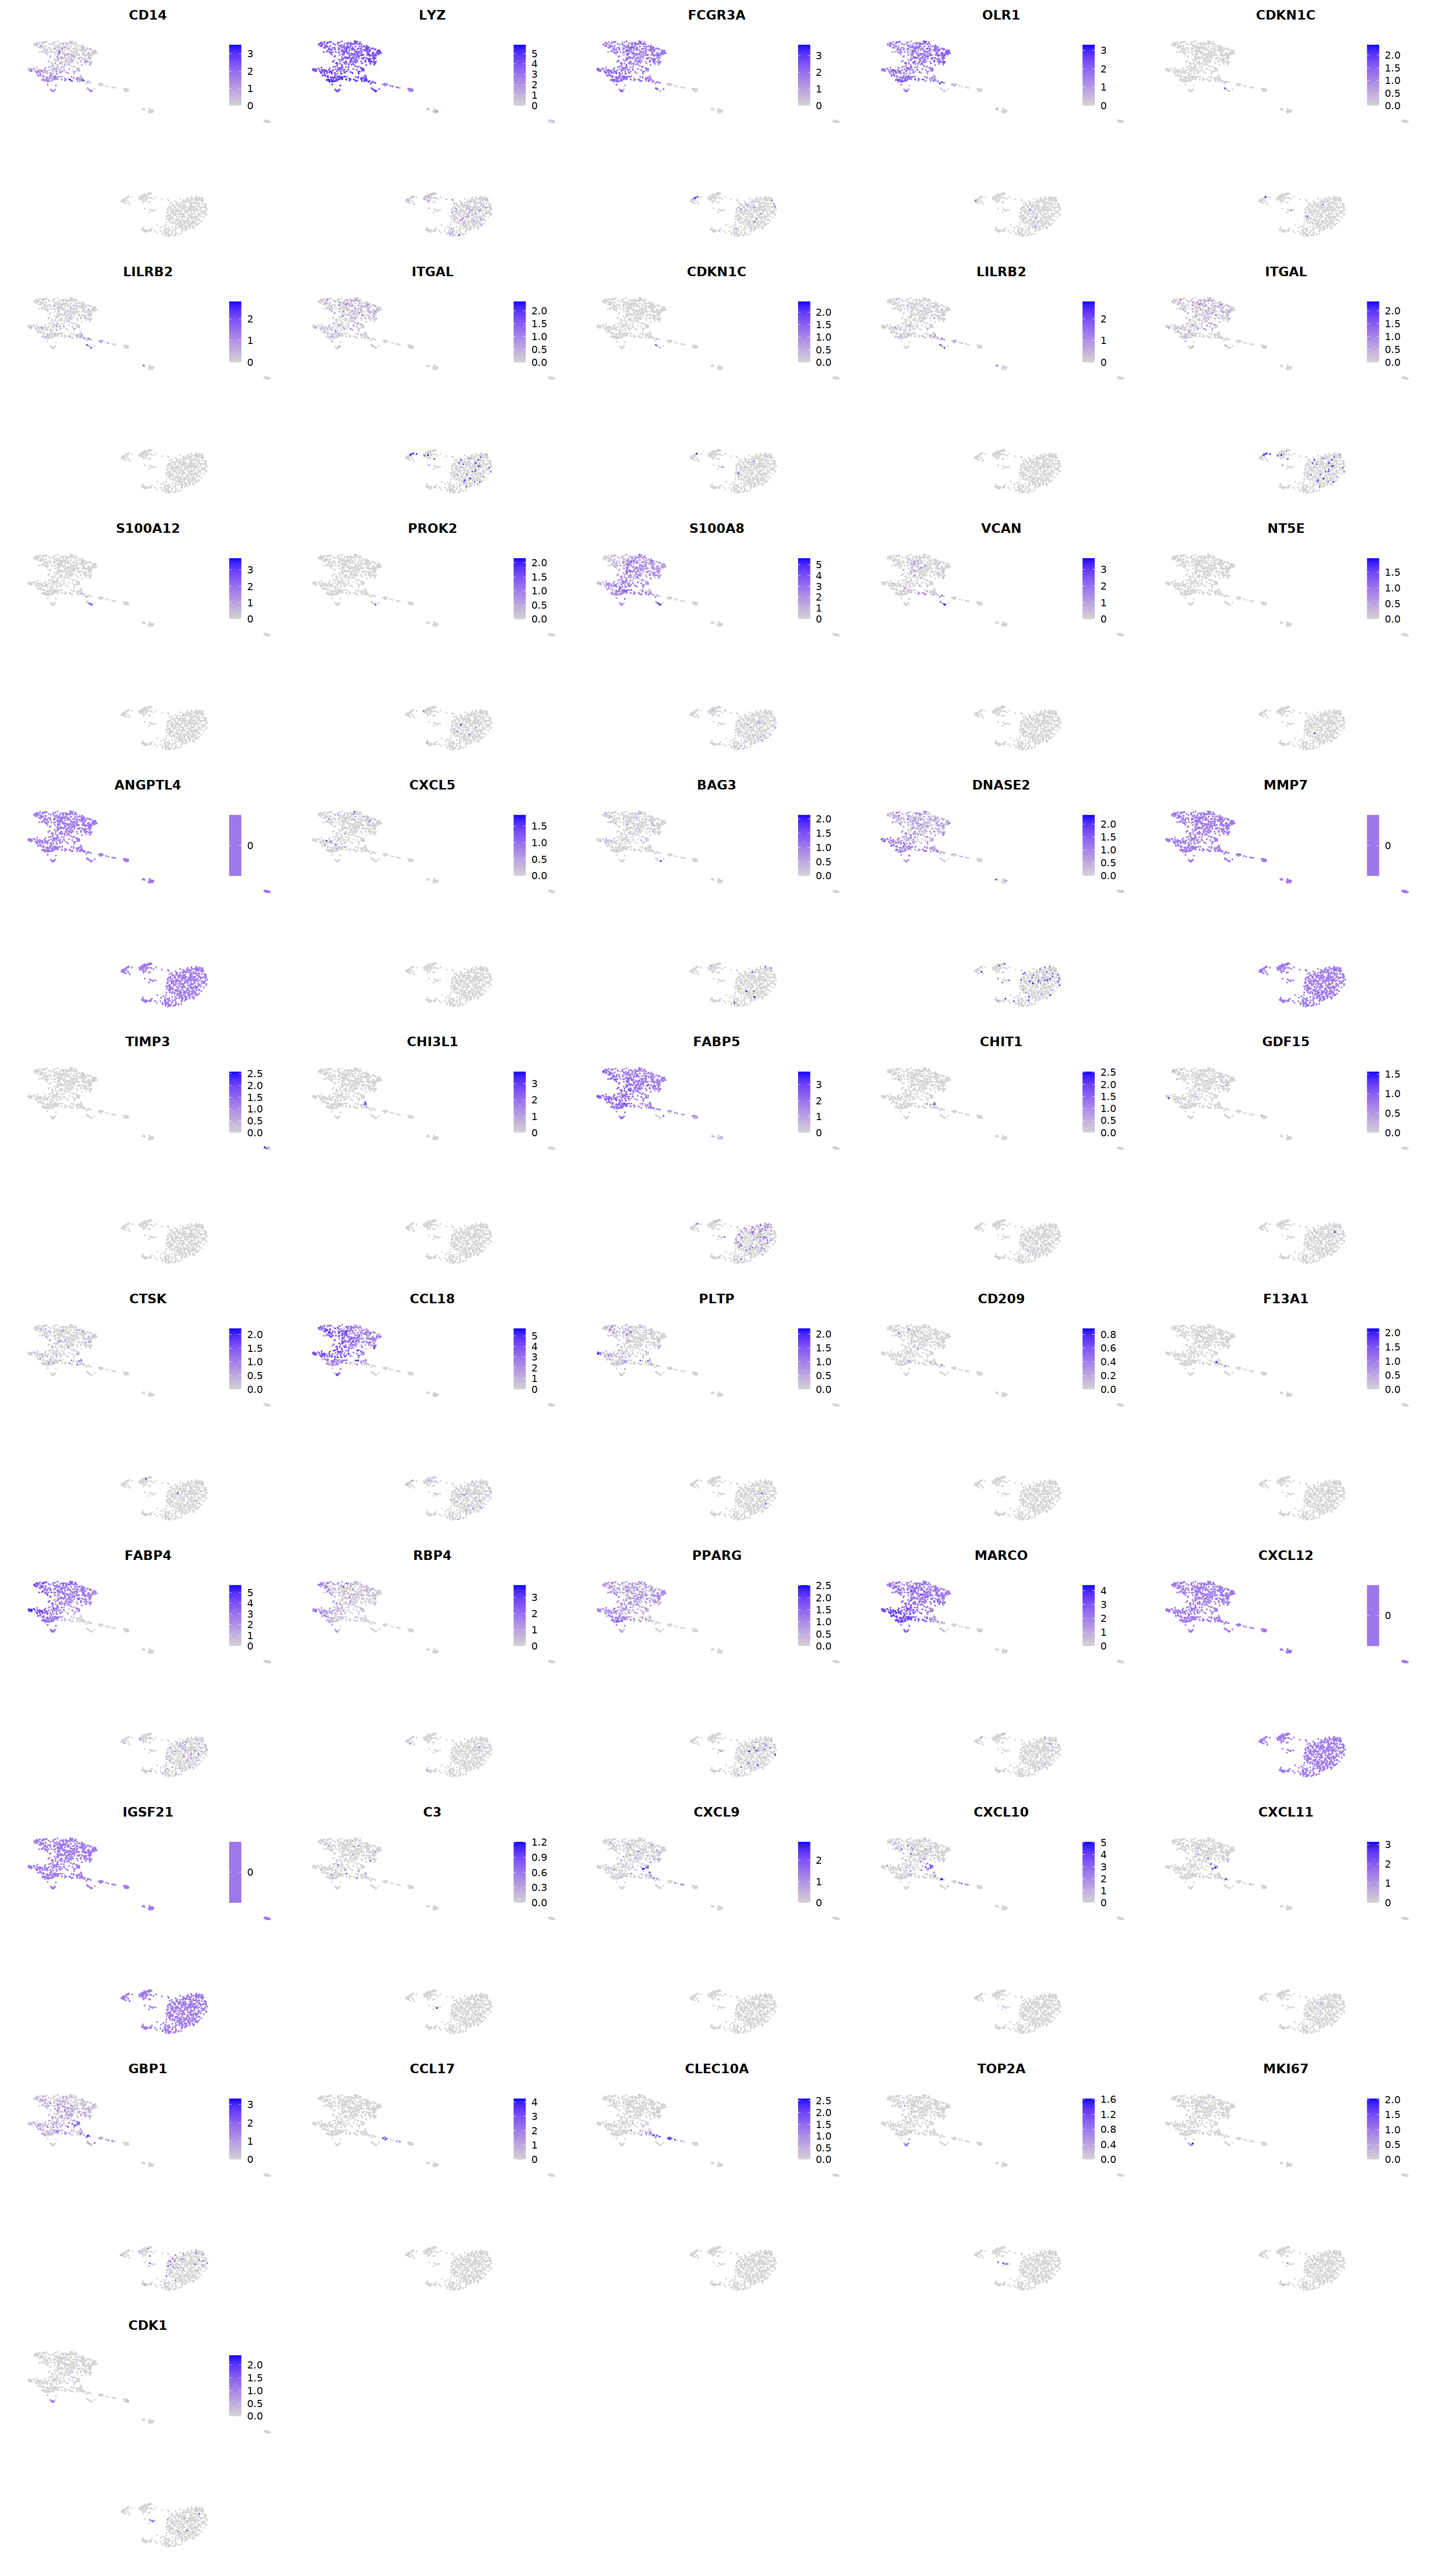
# macrophages
o(5*5, 5*9)
FeaturePlot(seu, ncol = 5, pt.size=0.01,
            features = c("CD14",'LYZ',"FCGR3A",
'OLR1','CDKN1C','LILRB2',"ITGAL",
'CDKN1C','LILRB2','ITGAL',
'S100A12','PROK2','S100A8','VCAN',
'NT5E','ANGPTL4','CXCL5','BAG3',
'DNASE2',
'MMP7','TIMP3','CHI3L1','FABP5',
'CHIT1','GDF15','CTSK',
'CCL18','PLTP','CD209','F13A1',
'FABP4','RBP4','PPARG','MARCO',
'CXCL12','IGSF21','C3',
'CXCL9','CXCL10','CXCL11','GBP1',
'CCL17',"CLEC10A",
"TOP2A","MKI67",'CDK1')
)&theme(
legend.position=c(0.8,0.8),
axis.line = element_blank(),
axis.title = element_blank(),axis.text = element_blank(), axis.ticks=element_blank()
)
Warning message in FeaturePlot(seu, ncol = 5, pt.size = 0.01, features = c("CD14", :
“All cells have the same value (0) of ANGPTL4.”
Warning message in FeaturePlot(seu, ncol = 5, pt.size = 0.01, features = c("CD14", :
“All cells have the same value (0) of MMP7.”
Warning message in FeaturePlot(seu, ncol = 5, pt.size = 0.01, features = c("CD14", :
“All cells have the same value (0) of CXCL12.”
Warning message in FeaturePlot(seu, ncol = 5, pt.size = 0.01, features = c("CD14", :
“All cells have the same value (0) of IGSF21.”
cell.sel = Cells(subset(seu, persample_ann=='Mye'))
seu@meta.data[cell.sel, "persample_ann"] = 'macrophage'

cell.sel = Cells(subset(seu, RNA_snn_res.0.9=='11'))
seu@meta.data[cell.sel, "persample_ann"] = 'macrophage'
T
# Treg
p=Nebulosa::plot_density(seu,c('CD3E','CD4','FOXP3'),joint=T)&theme(
    axis.title=element_blank(),axis.ticks=element_blank(),axis.text = element_blank())&NoLegend()

o(5*6, 5*1)
p+plot_layout(ncol = 6)

cell.sel = Cells(subset(seu, RNA_snn_res.0.9=='9'))
seu@meta.data[cell.sel, "persample_ann"] = 'Treg'
# CD8T
p=Nebulosa::plot_density(seu,c('CD3E','CD8A'),joint=T)&theme(
    axis.title=element_blank(),axis.ticks=element_blank(),axis.text = element_blank())&NoLegend()

o(5*6, 5*1)
p+plot_layout(ncol = 6)

cell.sel = Cells(subset(seu, RNA_snn_res.0.9=='4_0'))
seu@meta.data[cell.sel, "persample_ann"] = 'CD8 cytotoxic T'
gene_name= "SELL"
penalty = 4
expr    = seu@assays$RNA@data[gene_name,]
absence = exp(-expr*penalty)
seu@meta.data[, paste(gene_name,'lo',sep='_')] = absence

gene_name= "CCR7"
penalty = 4
expr    = seu@assays$RNA@data[gene_name,]
absence = exp(-expr*penalty)
seu@meta.data[, paste(gene_name,'lo',sep='_')] = absence

gene_name= "CD28"
penalty = 4
expr    = seu@assays$RNA@data[gene_name,]
absence = exp(-expr*penalty)
seu@meta.data[, paste(gene_name,'lo',sep='_')] = absence

gene_name= "CD44"
penalty = 4
expr    = seu@assays$RNA@data[gene_name,]
absence = exp(-expr*penalty)
seu@meta.data[, paste(gene_name,'lo',sep='_')] = absence

gene_name= "IL2RA"
penalty = 4
expr    = seu@assays$RNA@data[gene_name,]
absence = exp(-expr*penalty)
seu@meta.data[, paste(gene_name,'lo',sep='_')] = absence

gene_name= "CD69"
penalty = 4
expr    = seu@assays$RNA@data[gene_name,]
absence = exp(-expr*penalty)
seu@meta.data[, paste(gene_name,'lo',sep='_')] = absence
# Tcm
p=Nebulosa::plot_density(seu,c('SELL_lo','CD44','CCR7','CD28'),joint=T)&theme(
    axis.title=element_blank(),axis.ticks=element_blank(),axis.text = element_blank())&NoLegend()

o(5*6, 5*1)
p+plot_layout(ncol = 6)

# Tem
p=Nebulosa::plot_density(seu,c('SELL_lo','CD44','CCR7_lo','CD28'),joint=T)&theme(
    axis.title=element_blank(),axis.ticks=element_blank(),axis.text = element_blank())&NoLegend()

o(5*6, 5*1)
p+plot_layout(ncol = 6)

# Trm
p=Nebulosa::plot_density(seu,c('SELL_lo','CD44','CCR7_lo','ITGAE','CD69'),joint=T)&theme(
    axis.title=element_blank(),axis.ticks=element_blank(),axis.text = element_blank())&NoLegend()

o(5*6, 5*1)
p+plot_layout(ncol = 6)

# Naive T
p=Nebulosa::plot_density(seu,c('CD3E','CCR7','SELL',"IL2RG",'IL7R',
                               'CD44_lo','IL2RA_lo','CD69_lo'),joint=T)&theme(
    axis.title=element_blank(),axis.ticks=element_blank(),axis.text = element_blank())&NoLegend()

o(5*6, 5*2)
p+plot_layout(ncol = 6)

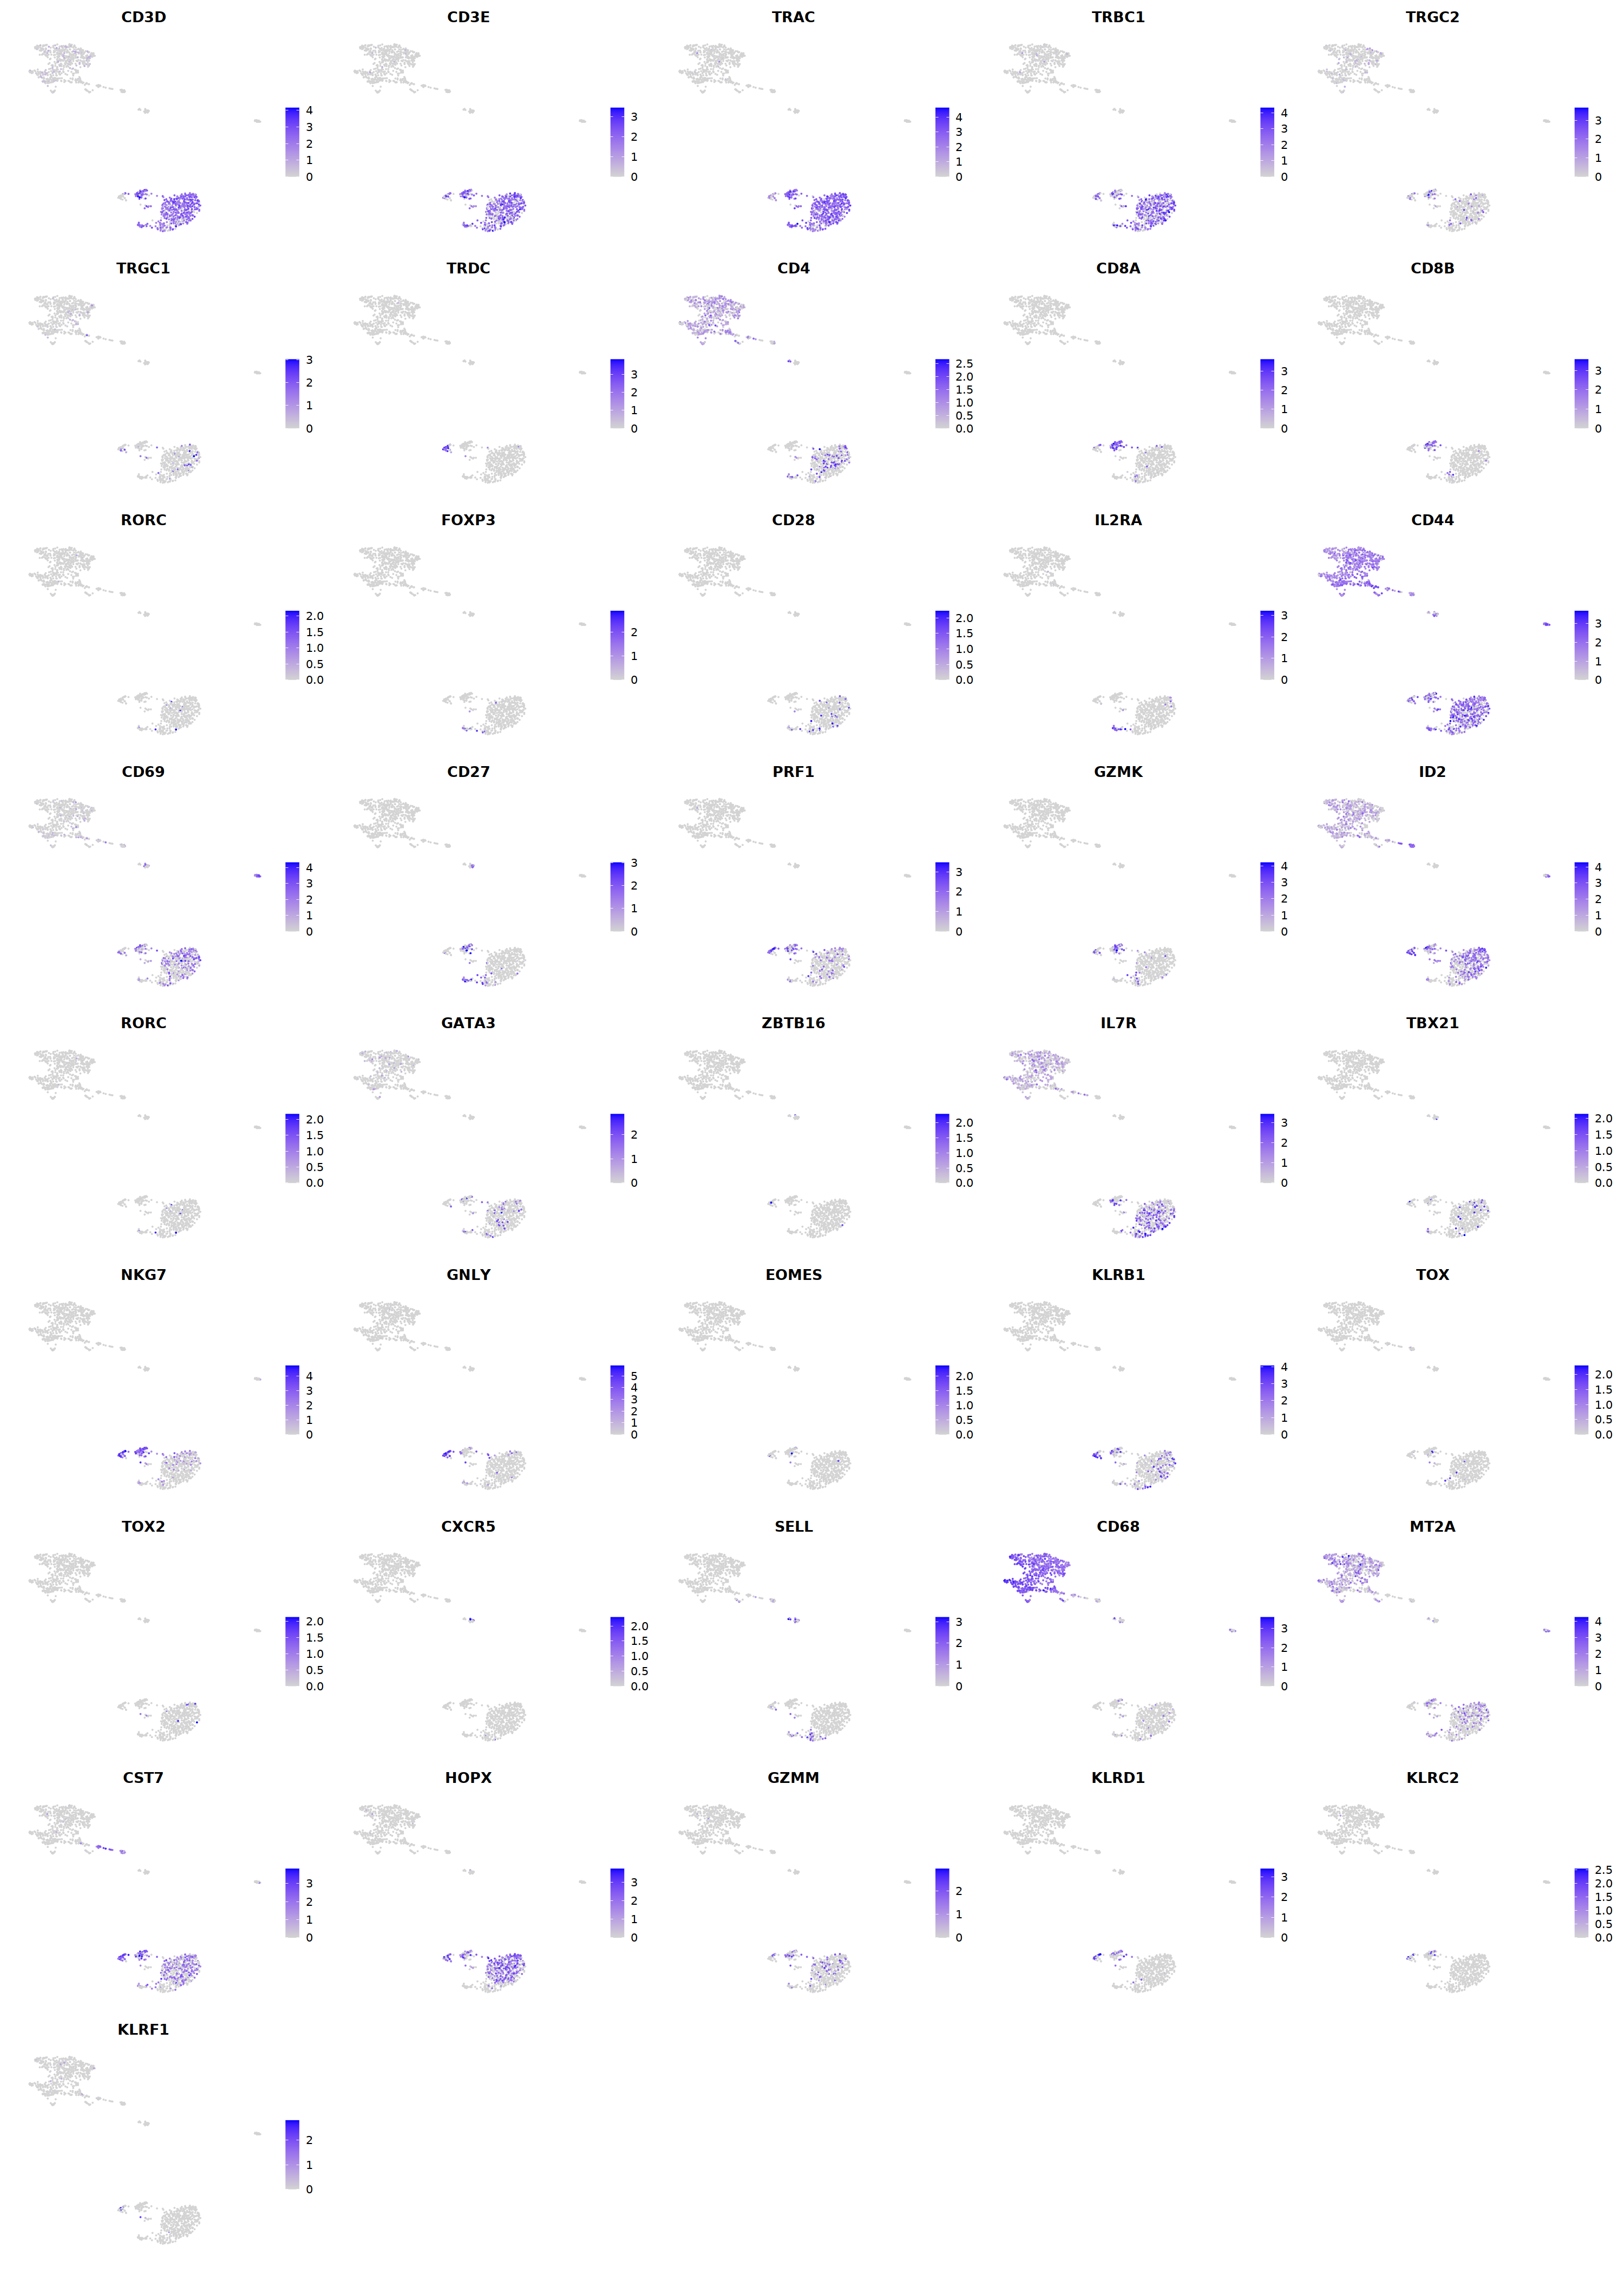
# T cell markers
o(5*5, 5*7)
FeaturePlot(seu, ncol = 5,pt.size=0.01,
features = c("CD3D","CD3E",'TRAC','TRBC1','TRGC2',
             'TRGC1','TRDC',"CD4",'CD8A','CD8B',
             'RORC','FOXP3','CD28','IL2RA',"CD44",
             'CD69','CD27','PRF1','GZMK','ID2',
             'RORC','GATA3','ZBTB16','IL7R','TBX21',
             'NKG7','GNLY','EOMES','KLRB1','TOX',
             "TOX2",'CXCR5','SELL','CD68','MT2A',
             'CST7','HOPX','GZMM','KLRD1','KLRC2',
             'KLRF1'), order=F)&theme(axis.line = element_blank(),
axis.title = element_blank(),axis.text = element_blank(), axis.ticks=element_blank()
)
cell.sel = Cells(subset(seu, RNA_snn_res.0.9=='1'))
seu@meta.data[cell.sel, "persample_ann"] = 'CD4 T'

cell.sel = Cells(subset(seu, RNA_snn_res.0.9=='2'))
seu@meta.data[cell.sel, "persample_ann"] = 'CD4 T'
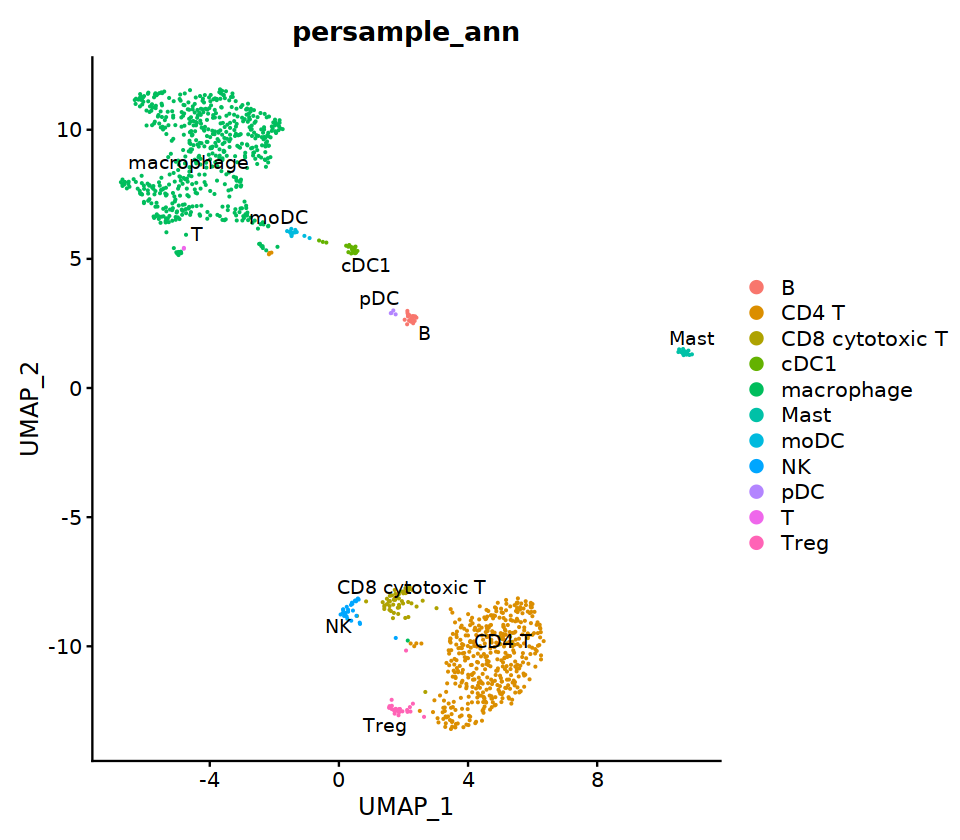
o(8,7);DimPlot(seu, group.by='persample_ann', label=T, repel=T, pt.size=0.1)
sample_name
seu -> immune.list[[sample_name]]
M1
# context switching
sample_name='M1'

seu= immune.list[[sample_name]]
group.by= 'RNA_snn_res.0.9'

Idents(seu)<-group.by
seu=FindSubCluster(seu, cluster='8',
                      graph.name="RNA_snn",
                      subcluster.name = "RNA_snn_res.0.9",  resolution = 0.5, algorithm = 1)

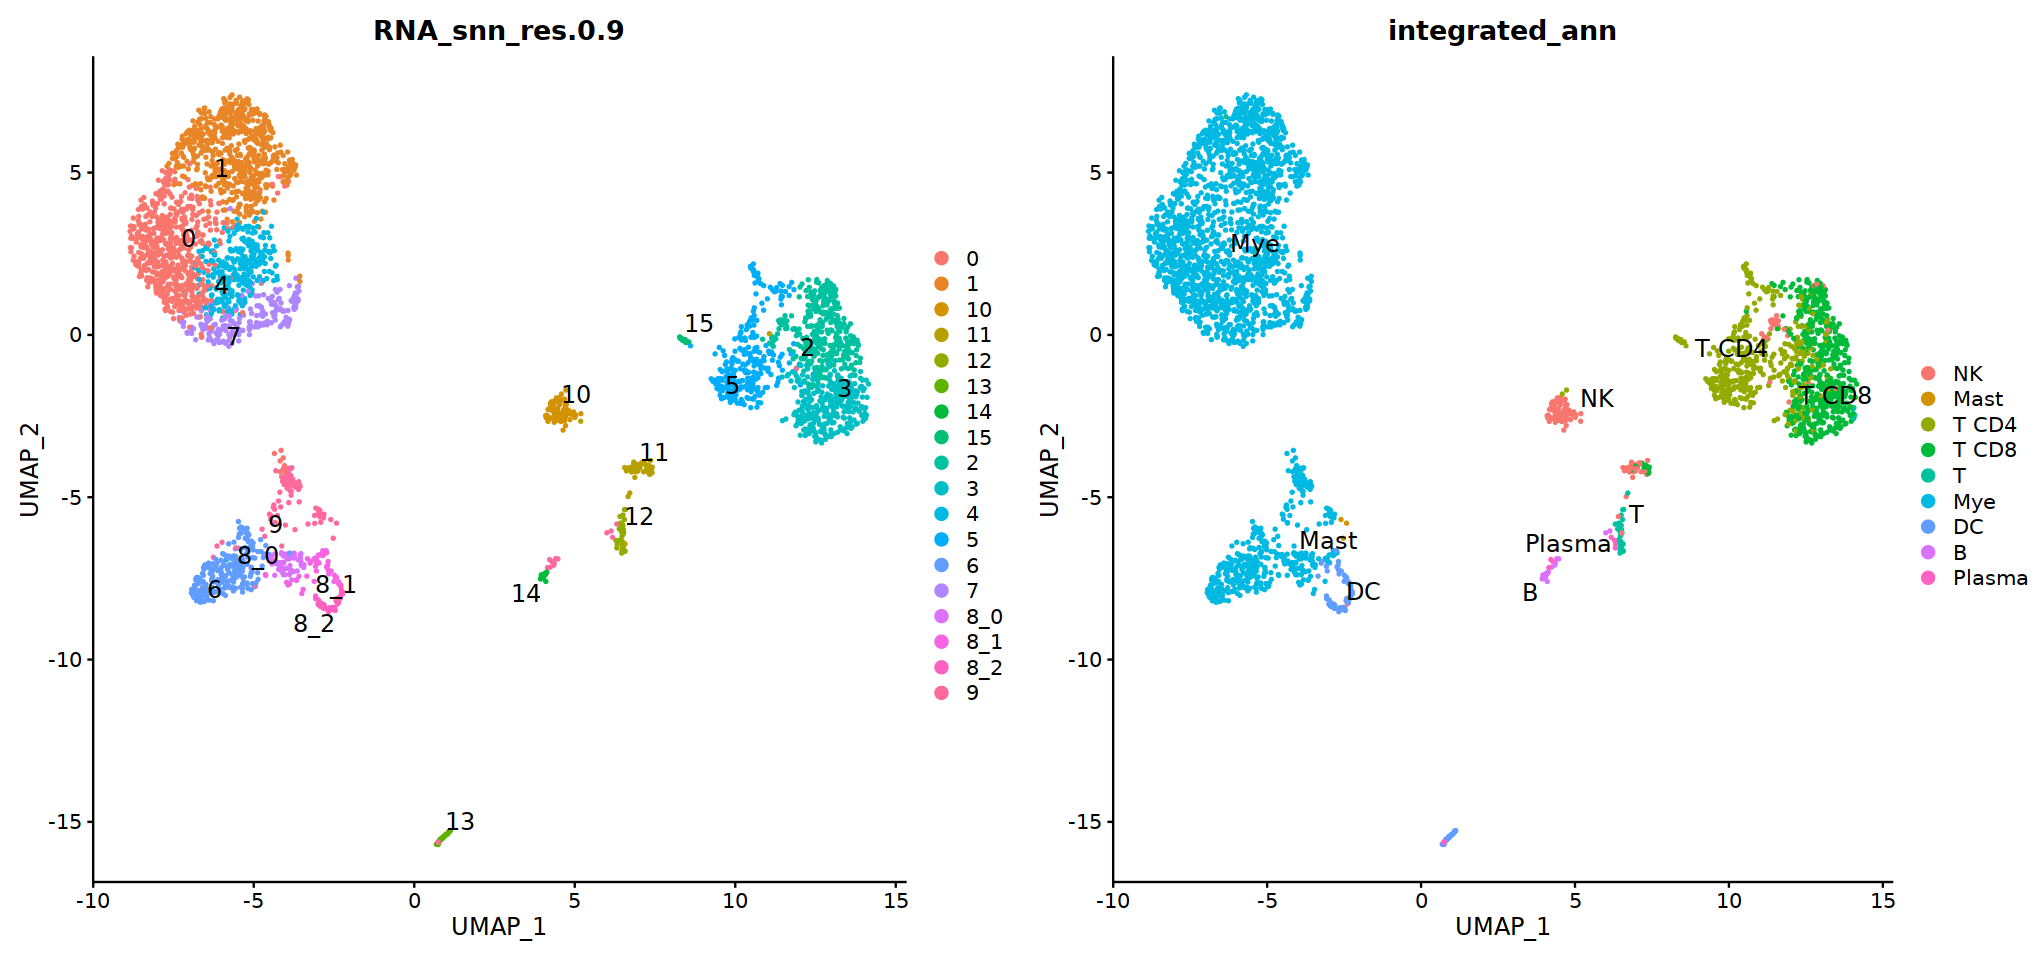
o(17,8)
ggarrange(
    DimPlot(seu, group.by=group.by, label=T,repel=T, label.size = 5),
    DimPlot(seu, group.by='integrated_ann',  label=T,repel=T, label.size = 5),
    nrow=1, ncol=2
)
Modularity Optimizer version 1.3.0 by Ludo Waltman and Nees Jan van Eck

Number of nodes: 144
Number of edges: 3299

Running Louvain algorithm...
Maximum modularity in 10 random starts: 0.7271
Number of communities: 3
Elapsed time: 0 seconds
Idents(seu) <- group.by
deg = FindMarkers(seu,assay='RNA',slot='data',only.pos=T, ident.1='11')
deg
| p_val | avg_log2FC | pct.1 | pct.2 | p_val_adj | |
|---|---|---|---|---|---|
| <dbl> | <dbl> | <dbl> | <dbl> | <dbl> | |
| KIR3DL2 | 0.000000e+00 | 2.1786166 | 0.754 | 0.010 | 0.000000e+00 |
| KIR2DL4 | 7.685209e-175 | 1.9190736 | 0.705 | 0.025 | 1.837995e-170 |
| KLRC3 | 1.529893e-143 | 1.6633549 | 0.738 | 0.034 | 3.658891e-139 |
| TRBV5-5 | 2.112813e-139 | 3.0289044 | 0.492 | 0.014 | 5.053004e-135 |
| SPRY2 | 9.378084e-127 | 0.9921556 | 0.377 | 0.008 | 2.242863e-122 |
| TRAV25 | 6.896820e-117 | 2.0037833 | 0.443 | 0.014 | 1.649443e-112 |
| FCRL6 | 6.902333e-112 | 1.7000809 | 0.705 | 0.046 | 1.650762e-107 |
| LINC02446 | 1.032828e-111 | 3.2892872 | 0.869 | 0.075 | 2.470111e-107 |
| NCR1 | 2.124001e-102 | 0.9002965 | 0.410 | 0.014 | 5.079762e-98 |
| KLRC2 | 2.754229e-101 | 1.0967324 | 0.475 | 0.020 | 6.587015e-97 |
| IFNG | 3.047808e-96 | 1.5862465 | 0.541 | 0.029 | 7.289137e-92 |
| KLRC1 | 3.563628e-93 | 2.8784505 | 0.984 | 0.126 | 8.522774e-89 |
| ADRB1 | 5.369798e-83 | 0.5039073 | 0.213 | 0.003 | 1.284241e-78 |
| DRAIC | 6.229063e-80 | 0.5837337 | 0.180 | 0.002 | 1.489743e-75 |
| CD160 | 7.357007e-75 | 0.9716211 | 0.328 | 0.012 | 1.759502e-70 |
| KIR2DL1 | 3.456413e-74 | 0.3505573 | 0.164 | 0.002 | 8.266358e-70 |
| KLRD1 | 3.171592e-71 | 2.2033547 | 0.951 | 0.145 | 7.585178e-67 |
| CAPN12 | 2.573811e-64 | 0.9934755 | 0.475 | 0.034 | 6.155526e-60 |
| SCUBE1 | 3.370731e-62 | 0.7167025 | 0.279 | 0.011 | 8.061439e-58 |
| GPR25 | 1.599348e-61 | 1.7819896 | 0.820 | 0.117 | 3.825002e-57 |
| HOPX | 1.267855e-57 | 2.6347099 | 0.951 | 0.206 | 3.032201e-53 |
| ZNF683 | 2.341302e-55 | 2.2292551 | 0.820 | 0.134 | 5.599458e-51 |
| STYK1 | 1.076758e-53 | 0.5668320 | 0.262 | 0.011 | 2.575175e-49 |
| CD7 | 3.397787e-53 | 2.7637316 | 0.984 | 0.265 | 8.126147e-49 |
| DAPK2 | 3.525029e-52 | 0.9667180 | 0.443 | 0.037 | 8.430458e-48 |
| TRBV12-4 | 4.112478e-50 | 2.8266272 | 0.279 | 0.015 | 9.835403e-46 |
| CCL5 | 1.865935e-49 | 3.0344024 | 1.000 | 0.347 | 4.462571e-45 |
| CLNK | 2.443463e-49 | 0.7835452 | 0.295 | 0.017 | 5.843787e-45 |
| SIRPG | 2.734644e-48 | 1.0740205 | 0.475 | 0.047 | 6.540174e-44 |
| TIGIT | 4.644428e-48 | 1.5300163 | 0.623 | 0.083 | 1.110761e-43 |
| ⋮ | ⋮ | ⋮ | ⋮ | ⋮ | ⋮ |
| EIF4G3 | 0.8878534 | 0.2885656 | 0.246 | 0.292 | 1 |
| ARFGEF1 | 0.8908625 | 0.2539340 | 0.279 | 0.358 | 1 |
| MOSPD3 | 0.8915736 | 0.2834091 | 0.246 | 0.294 | 1 |
| NOB1 | 0.8916808 | 0.2672959 | 0.246 | 0.306 | 1 |
| ZRANB2 | 0.8944736 | 0.3037154 | 0.475 | 0.668 | 1 |
| RAE1 | 0.9002171 | 0.2532087 | 0.197 | 0.222 | 1 |
| SUPT6H | 0.9050541 | 0.3445144 | 0.311 | 0.384 | 1 |
| TSPAN17 | 0.9079554 | 0.2917975 | 0.148 | 0.175 | 1 |
| INPP5F | 0.9120330 | 0.2700833 | 0.164 | 0.183 | 1 |
| KPNA4 | 0.9226017 | 0.2749224 | 0.328 | 0.422 | 1 |
| PRPF38A | 0.9306065 | 0.2563815 | 0.279 | 0.355 | 1 |
| SLC25A32 | 0.9309816 | 0.3256083 | 0.246 | 0.290 | 1 |
| CERS2 | 0.9312347 | 0.2798372 | 0.262 | 0.318 | 1 |
| GIGYF2 | 0.9323967 | 0.2723675 | 0.262 | 0.331 | 1 |
| SF3B3 | 0.9424417 | 0.2634504 | 0.279 | 0.334 | 1 |
| GPS2 | 0.9498673 | 0.2958202 | 0.246 | 0.299 | 1 |
| CALCOCO1 | 0.9524569 | 0.2633317 | 0.295 | 0.387 | 1 |
| LCMT1 | 0.9532797 | 0.3133821 | 0.311 | 0.399 | 1 |
| ICE1 | 0.9593637 | 0.2874744 | 0.311 | 0.387 | 1 |
| HIF1AN | 0.9602518 | 0.2693053 | 0.213 | 0.249 | 1 |
| FOXN2 | 0.9636880 | 0.2564759 | 0.328 | 0.415 | 1 |
| COPB2 | 0.9645116 | 0.2907865 | 0.377 | 0.494 | 1 |
| SMC5 | 0.9646697 | 0.2834778 | 0.279 | 0.340 | 1 |
| PTPRJ | 0.9753070 | 0.3492027 | 0.279 | 0.349 | 1 |
| PSENEN | 0.9760221 | 0.2736422 | 0.361 | 0.486 | 1 |
| PCF11 | 0.9827711 | 0.2674932 | 0.344 | 0.442 | 1 |
| LTBP3 | 0.9935487 | 0.2681530 | 0.180 | 0.213 | 1 |
| ITCH | 0.9935728 | 0.2728780 | 0.262 | 0.328 | 1 |
| DMAP1 | 0.9958375 | 0.2597009 | 0.213 | 0.254 | 1 |
| CDK13 | 0.9977642 | 0.2661889 | 0.262 | 0.324 | 1 |
Idents(seu) <- group.by
deg = FindMarkers(seu,assay='RNA',slot='data',only.pos=T, ident.1='12')
deg
| p_val | avg_log2FC | pct.1 | pct.2 | p_val_adj | |
|---|---|---|---|---|---|
| <dbl> | <dbl> | <dbl> | <dbl> | <dbl> | |
| KIF2C | 0.000000e+00 | 1.1756104 | 0.675 | 0.004 | 0.000000e+00 |
| ASPM | 0.000000e+00 | 2.2944559 | 0.800 | 0.004 | 0.000000e+00 |
| RRM2 | 0.000000e+00 | 1.4586486 | 0.725 | 0.001 | 0.000000e+00 |
| NCAPH | 0.000000e+00 | 1.1823067 | 0.775 | 0.007 | 0.000000e+00 |
| CKAP2L | 0.000000e+00 | 1.2636463 | 0.775 | 0.005 | 0.000000e+00 |
| SPC25 | 0.000000e+00 | 0.7661932 | 0.550 | 0.001 | 0.000000e+00 |
| HJURP | 0.000000e+00 | 0.9933127 | 0.575 | 0.000 | 0.000000e+00 |
| MND1 | 0.000000e+00 | 1.1312730 | 0.675 | 0.005 | 0.000000e+00 |
| HIST1H3B | 0.000000e+00 | 1.7144875 | 0.550 | 0.000 | 0.000000e+00 |
| HIST1H3C | 0.000000e+00 | 1.8881987 | 0.550 | 0.002 | 0.000000e+00 |
| E2F8 | 0.000000e+00 | 0.8069518 | 0.450 | 0.000 | 0.000000e+00 |
| FAM111B | 0.000000e+00 | 1.3487702 | 0.550 | 0.002 | 0.000000e+00 |
| MKI67 | 0.000000e+00 | 2.8873081 | 0.950 | 0.010 | 0.000000e+00 |
| FOXM1 | 0.000000e+00 | 0.7890675 | 0.675 | 0.001 | 0.000000e+00 |
| DLGAP5 | 0.000000e+00 | 1.2534687 | 0.625 | 0.001 | 0.000000e+00 |
| PKMYT1 | 0.000000e+00 | 1.2220761 | 0.675 | 0.002 | 0.000000e+00 |
| AURKB | 0.000000e+00 | 1.2278547 | 0.700 | 0.004 | 0.000000e+00 |
| TOP2A | 0.000000e+00 | 2.0892430 | 0.875 | 0.006 | 0.000000e+00 |
| BIRC5 | 0.000000e+00 | 1.7896602 | 0.775 | 0.002 | 0.000000e+00 |
| UBE2C | 0.000000e+00 | 2.5020345 | 0.850 | 0.005 | 0.000000e+00 |
| UHRF1 | 0.000000e+00 | 1.3846717 | 0.700 | 0.005 | 0.000000e+00 |
| GTSE1 | 0.000000e+00 | 1.3517517 | 0.725 | 0.002 | 0.000000e+00 |
| PCLAF | 1.243897e-304 | 1.4331909 | 0.750 | 0.007 | 2.974905e-300 |
| ANLN | 1.209459e-301 | 0.7582207 | 0.575 | 0.003 | 2.892542e-297 |
| DIAPH3 | 9.136409e-287 | 0.6841952 | 0.525 | 0.002 | 2.185063e-282 |
| HIST1H3G | 1.002493e-286 | 1.0488253 | 0.475 | 0.001 | 2.397561e-282 |
| CCNA2 | 2.029321e-286 | 1.7997124 | 0.825 | 0.011 | 4.853325e-282 |
| CDCA3 | 1.409632e-281 | 1.3013740 | 0.700 | 0.007 | 3.371275e-277 |
| CDCA5 | 6.624292e-275 | 1.1181555 | 0.650 | 0.006 | 1.584266e-270 |
| HIST1H1B | 3.870409e-270 | 2.3822608 | 0.700 | 0.008 | 9.256470e-266 |
| ⋮ | ⋮ | ⋮ | ⋮ | ⋮ | ⋮ |
| TRIAP1 | 0.07143305 | 0.2559578 | 0.475 | 0.396 | 1 |
| IPO7 | 0.07238571 | 0.3464208 | 0.500 | 0.443 | 1 |
| PNPT1 | 0.07369673 | 0.3340546 | 0.675 | 0.625 | 1 |
| IMPDH1 | 0.07407755 | 0.3315927 | 0.475 | 0.396 | 1 |
| HNRNPH3 | 0.07412438 | 0.2542357 | 0.725 | 0.629 | 1 |
| ERLEC1 | 0.08023860 | 0.3675875 | 0.700 | 0.564 | 1 |
| CASP7 | 0.08362430 | 0.2877606 | 0.400 | 0.317 | 1 |
| TARBP1 | 0.09254328 | 0.2948395 | 0.300 | 0.209 | 1 |
| TSG101 | 0.09561719 | 0.2532595 | 0.625 | 0.522 | 1 |
| PKM | 0.10264382 | 0.3423692 | 0.950 | 0.831 | 1 |
| MT-ND4 | 0.10480802 | 0.3658594 | 0.950 | 0.837 | 1 |
| ITGB1 | 0.10790781 | 0.4313561 | 0.775 | 0.750 | 1 |
| YTHDC2 | 0.11919497 | 0.2525055 | 0.325 | 0.247 | 1 |
| ENTPD1 | 0.14936789 | 0.2993196 | 0.275 | 0.212 | 1 |
| RDX | 0.15177806 | 0.3030574 | 0.400 | 0.371 | 1 |
| UBA7 | 0.17664017 | 0.2761717 | 0.475 | 0.417 | 1 |
| RSRC1 | 0.18261479 | 0.3193864 | 0.450 | 0.395 | 1 |
| LYAR | 0.18974105 | 0.2705067 | 0.525 | 0.480 | 1 |
| UBE2J1 | 0.19217076 | 0.3288277 | 0.550 | 0.514 | 1 |
| IBTK | 0.20171859 | 0.2803821 | 0.425 | 0.382 | 1 |
| PHPT1 | 0.20544918 | 0.2936416 | 0.800 | 0.709 | 1 |
| MAT2A | 0.20756584 | 0.2745334 | 0.625 | 0.592 | 1 |
| ABI3 | 0.23875829 | 0.2883457 | 0.675 | 0.591 | 1 |
| CLN6 | 0.24075588 | 0.2728546 | 0.250 | 0.202 | 1 |
| ID3 | 0.25145914 | 0.2785842 | 0.325 | 0.271 | 1 |
| WDFY1 | 0.25816693 | 0.2658322 | 0.500 | 0.457 | 1 |
| ATF1 | 0.29310608 | 0.2754423 | 0.300 | 0.254 | 1 |
| SLC25A26 | 0.34536438 | 0.2617154 | 0.250 | 0.210 | 1 |
| TRGV7 | 0.78423451 | 0.3606547 | 0.100 | 0.122 | 1 |
| NOC3L | 0.98134010 | 0.3191381 | 0.300 | 0.339 | 1 |
# adopt integrated_ann first
seu@meta.data[, "persample_ann"] = as.character(seu@meta.data[, "integrated_ann"] )
o(10,10)

DimPlot(seu,
        group.by='RNA_snn_res.0.9',label=T,  cols=manymanycolors)
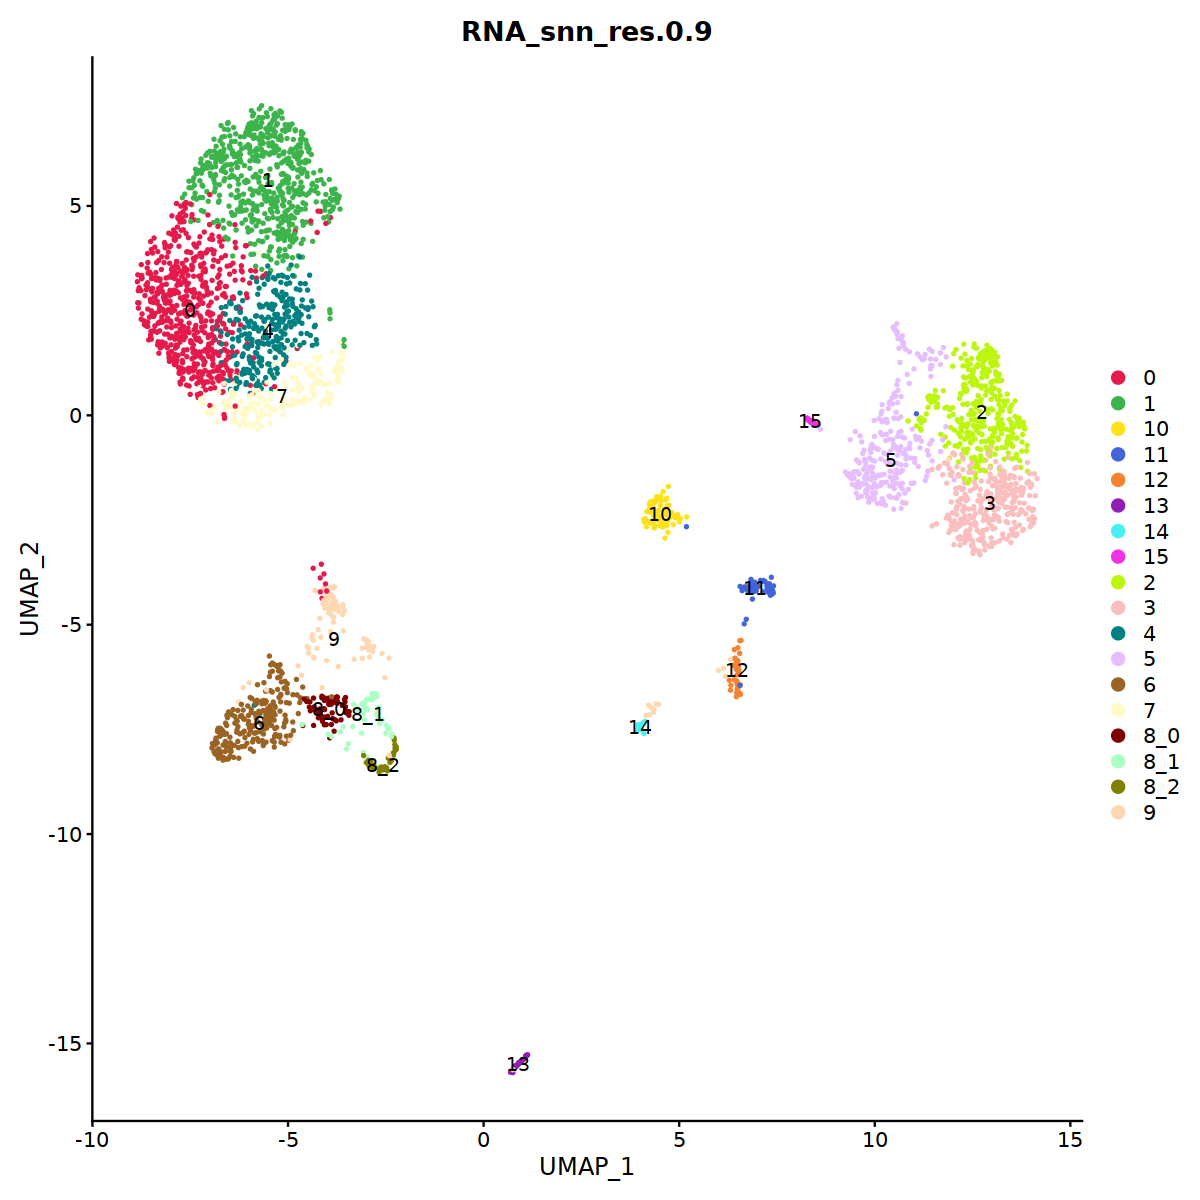
DC
# cDC1
p=Nebulosa::plot_density(seu,c('HLA-DQA1','BATF3','CADM1','CLEC9A','XCR1'),joint=T)&theme(
    axis.title=element_blank(),axis.ticks=element_blank(),axis.text = element_blank())&NoLegend()

o(5*6, 5*1)
p+plot_layout(ncol = 6)

# cDC2
p=Nebulosa::plot_density(seu,c('CD14','PLD4','CD1C','CX3CR1','CLEC10A'),joint=T)&theme(
    axis.title=element_blank(),axis.ticks=element_blank(),axis.text = element_blank())&NoLegend()

o(5*6, 5*1)
p+plot_layout(ncol = 6)

# pDC
p=Nebulosa::plot_density(seu,c('CLEC4C','IRF4','LILRA4','LILRB4','IRF8'),joint=T)&theme(
    axis.title=element_blank(),axis.ticks=element_blank(),axis.text = element_blank())&NoLegend()

o(5*6, 5*1)
p+plot_layout(ncol = 6)

# moDC
p=Nebulosa::plot_density(seu,c('CD14','CD1C','FCER1A','CD1E'),joint=T)&theme(
    axis.title=element_blank(),axis.ticks=element_blank(),axis.text = element_blank())&NoLegend()

o(5*6, 5*1)
p+plot_layout(ncol = 6)

# DC markers
o(5*5, 5*4)
FeaturePlot(seu, ncol = 5,pt.size=0.01,
            features = c('CST3','FCER1A','ITGAX',# pan DC
                         'LAMP3','CLEC9A',#cDC1
                         "CD1C",'HLA-DQA1',"PLD4",# cDC2
                         'LILRA4','LILRB4','IRF8','CCR7', #pDC
                         'CCL17','CD163','CD14','FCER1A','CD1A','MRC1'#moDC
                        )
           )&theme(
legend.position=c(0.8,0.8),
axis.line = element_blank(),
axis.title = element_blank(),axis.text = element_blank(), axis.ticks=element_blank()
)
Warning message in FeaturePlot(seu, ncol = 5, pt.size = 0.01, features = c("CST3", :
“All cells have the same value (0) of CD1A.”
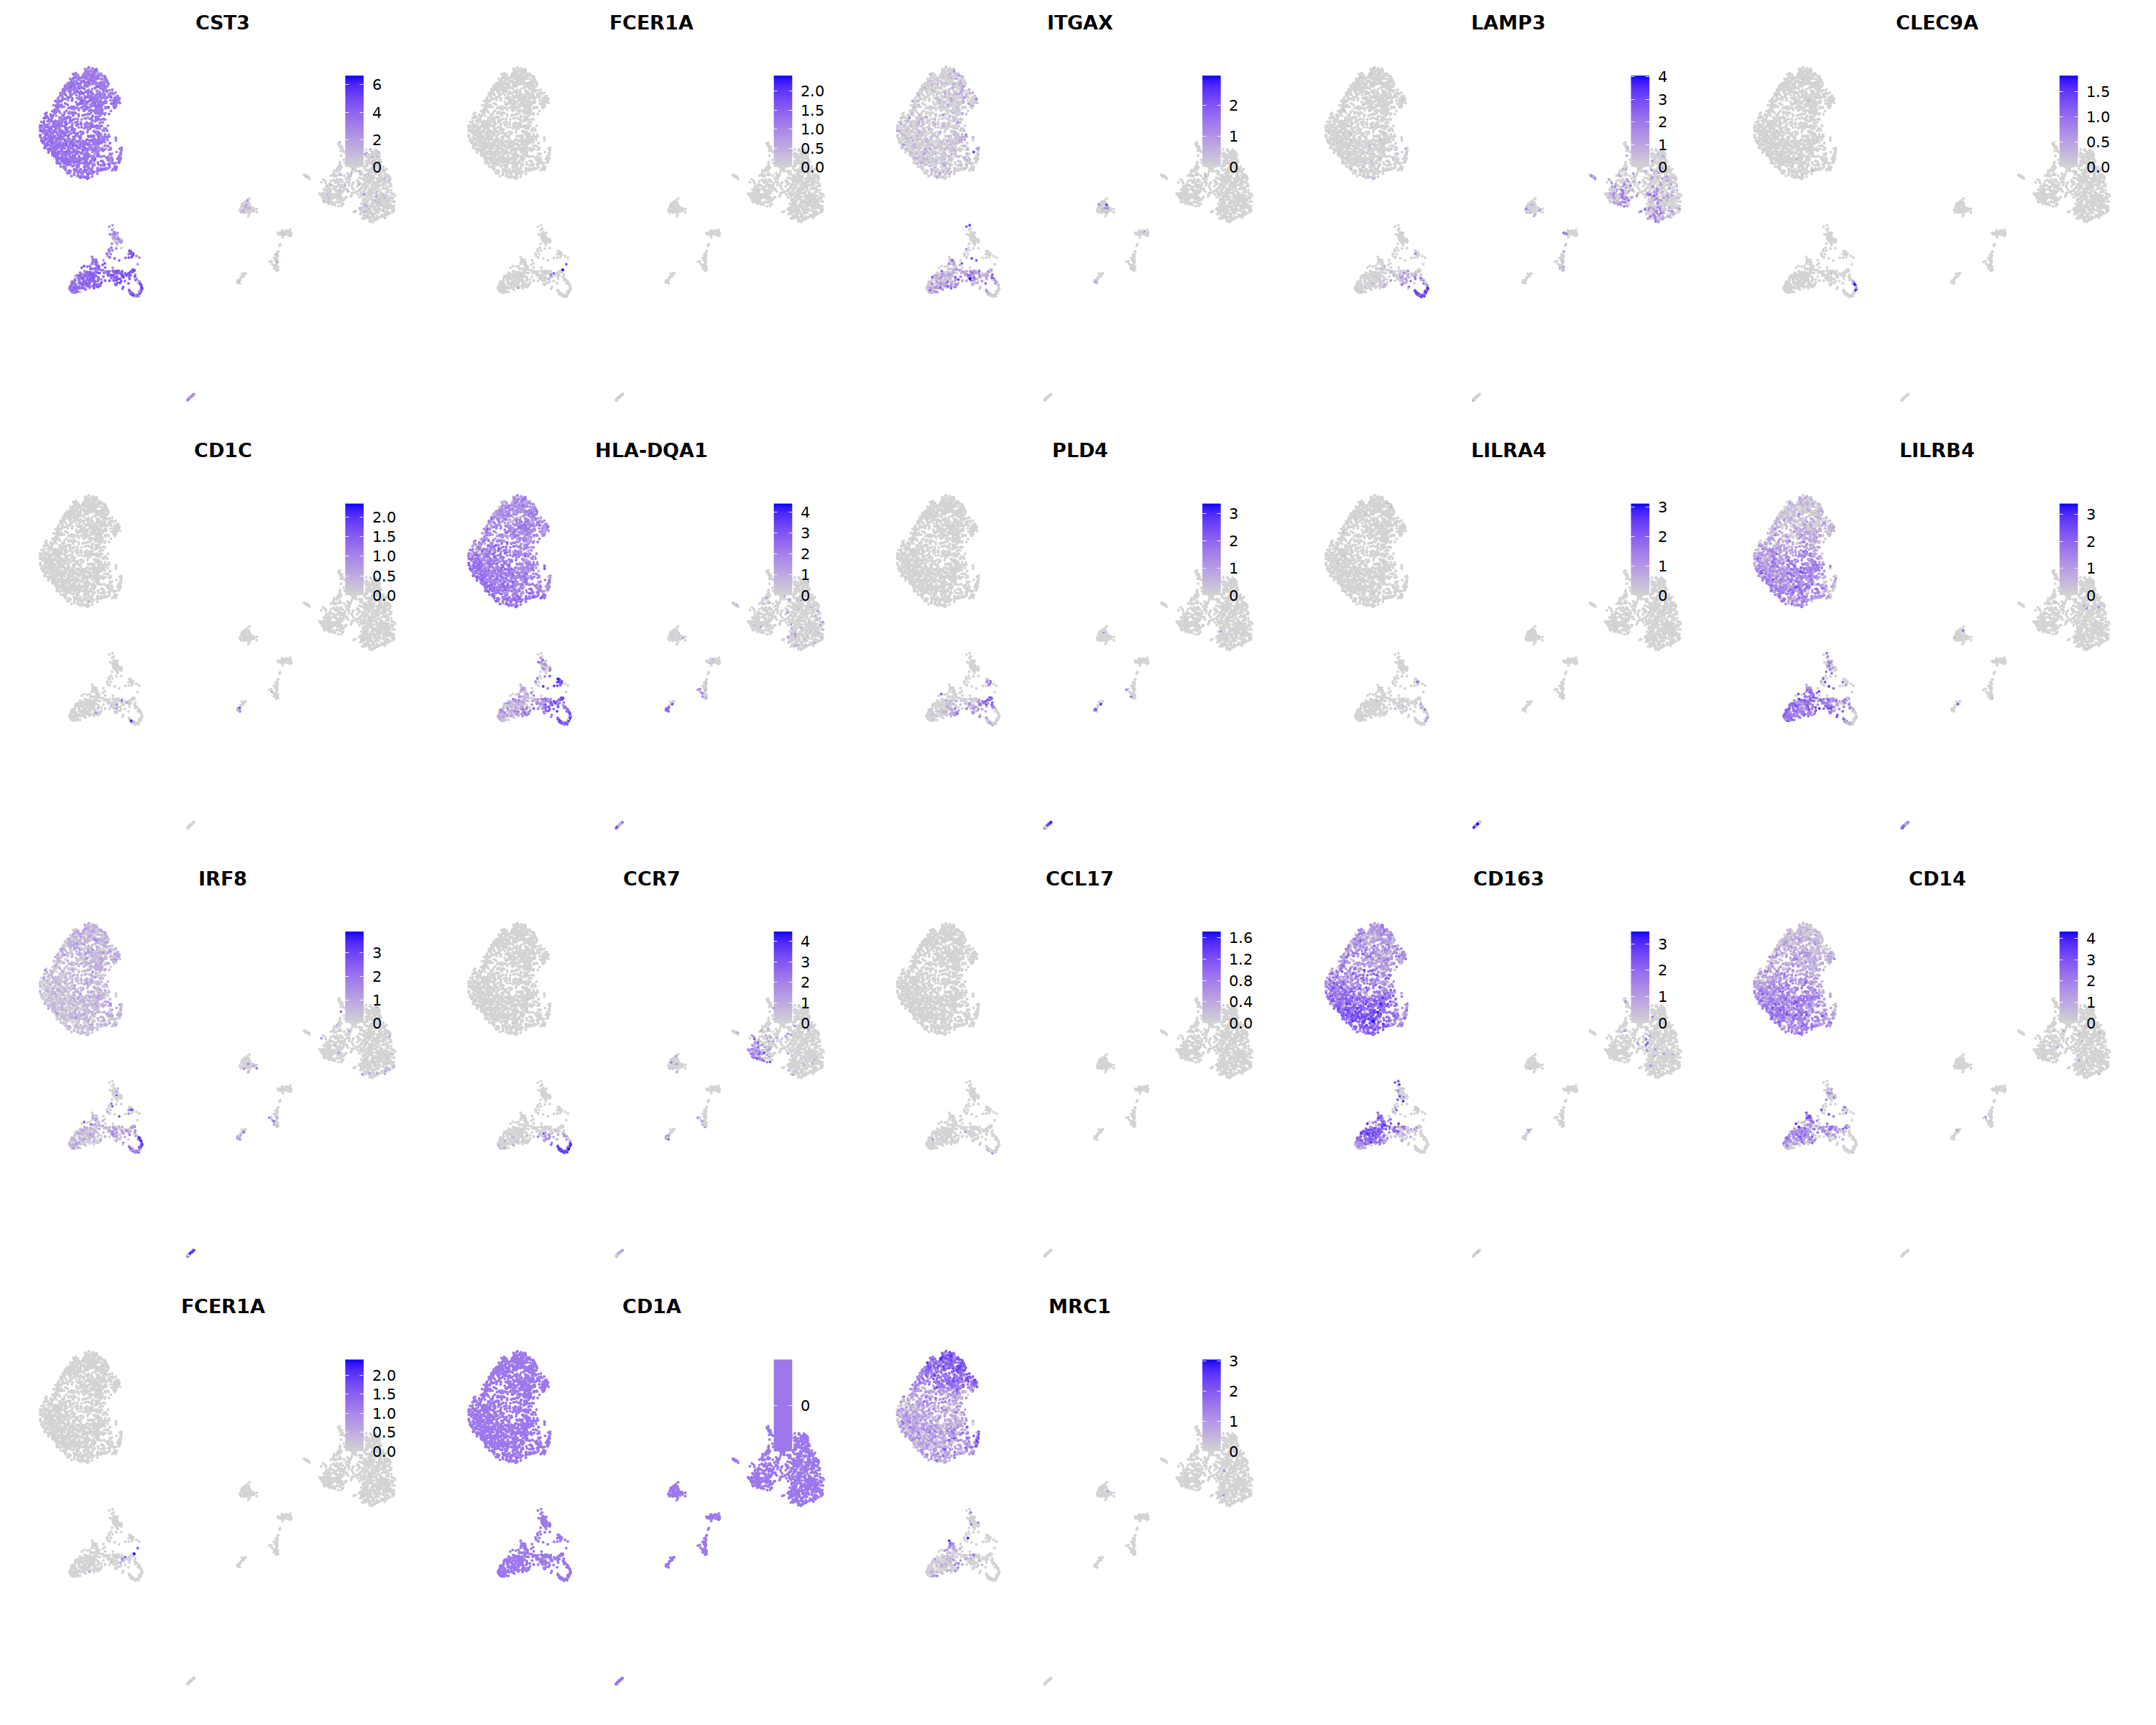
cell.sel = Cells(subset(seu, RNA_snn_res.0.9=='8_1'))
seu@meta.data[cell.sel, "persample_ann"] = 'cDC1'

cell.sel = Cells(subset(seu, RNA_snn_res.0.9=='8_2'))
seu@meta.data[cell.sel, "persample_ann"] = 'cDC1'
cell.sel = Cells(subset(seu, RNA_snn_res.0.9=='8_0'))
seu@meta.data[cell.sel, "persample_ann"] = 'cDC2'
cell.sel = Cells(subset(seu, RNA_snn_res.0.9=='13'))
seu@meta.data[cell.sel, "persample_ann"] = 'pDC'
Mac
o(8,8)
FeaturePlot(seu,features = 'S100A12',order=T)
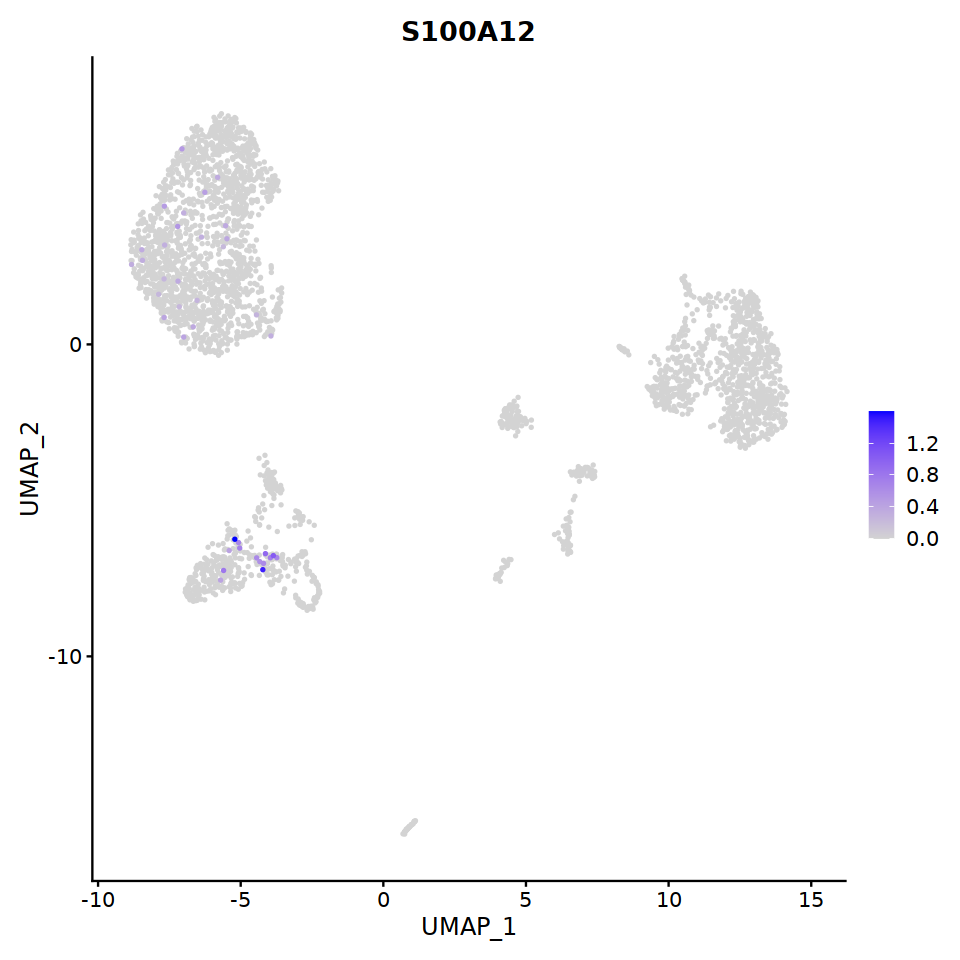
# macrophages
o(5*5, 5*9)
FeaturePlot(seu, ncol = 5, pt.size=0.01,
            features = c("CD14",'LYZ',"FCGR3A",
'OLR1','CDKN1C','LILRB2',"ITGAL",
'CDKN1C','LILRB2','ITGAL',
'S100A12','PROK2','S100A8','VCAN',
'NT5E','ANGPTL4','CXCL5','BAG3',
'DNASE2',
'MMP7','TIMP3','CHI3L1','FABP5',
'CHIT1','GDF15','CTSK',
'CCL18','PLTP','CD209','F13A1',
'FABP4','RBP4','PPARG','MARCO',
'CXCL12','IGSF21','C3',
'CXCL9','CXCL10','CXCL11','GBP1',
'CCL17',"CLEC10A",
"TOP2A","MKI67",'CDK1')
)&theme(
legend.position=c(0.8,0.8),
axis.line = element_blank(),
axis.title = element_blank(),axis.text = element_blank(), axis.ticks=element_blank()
)
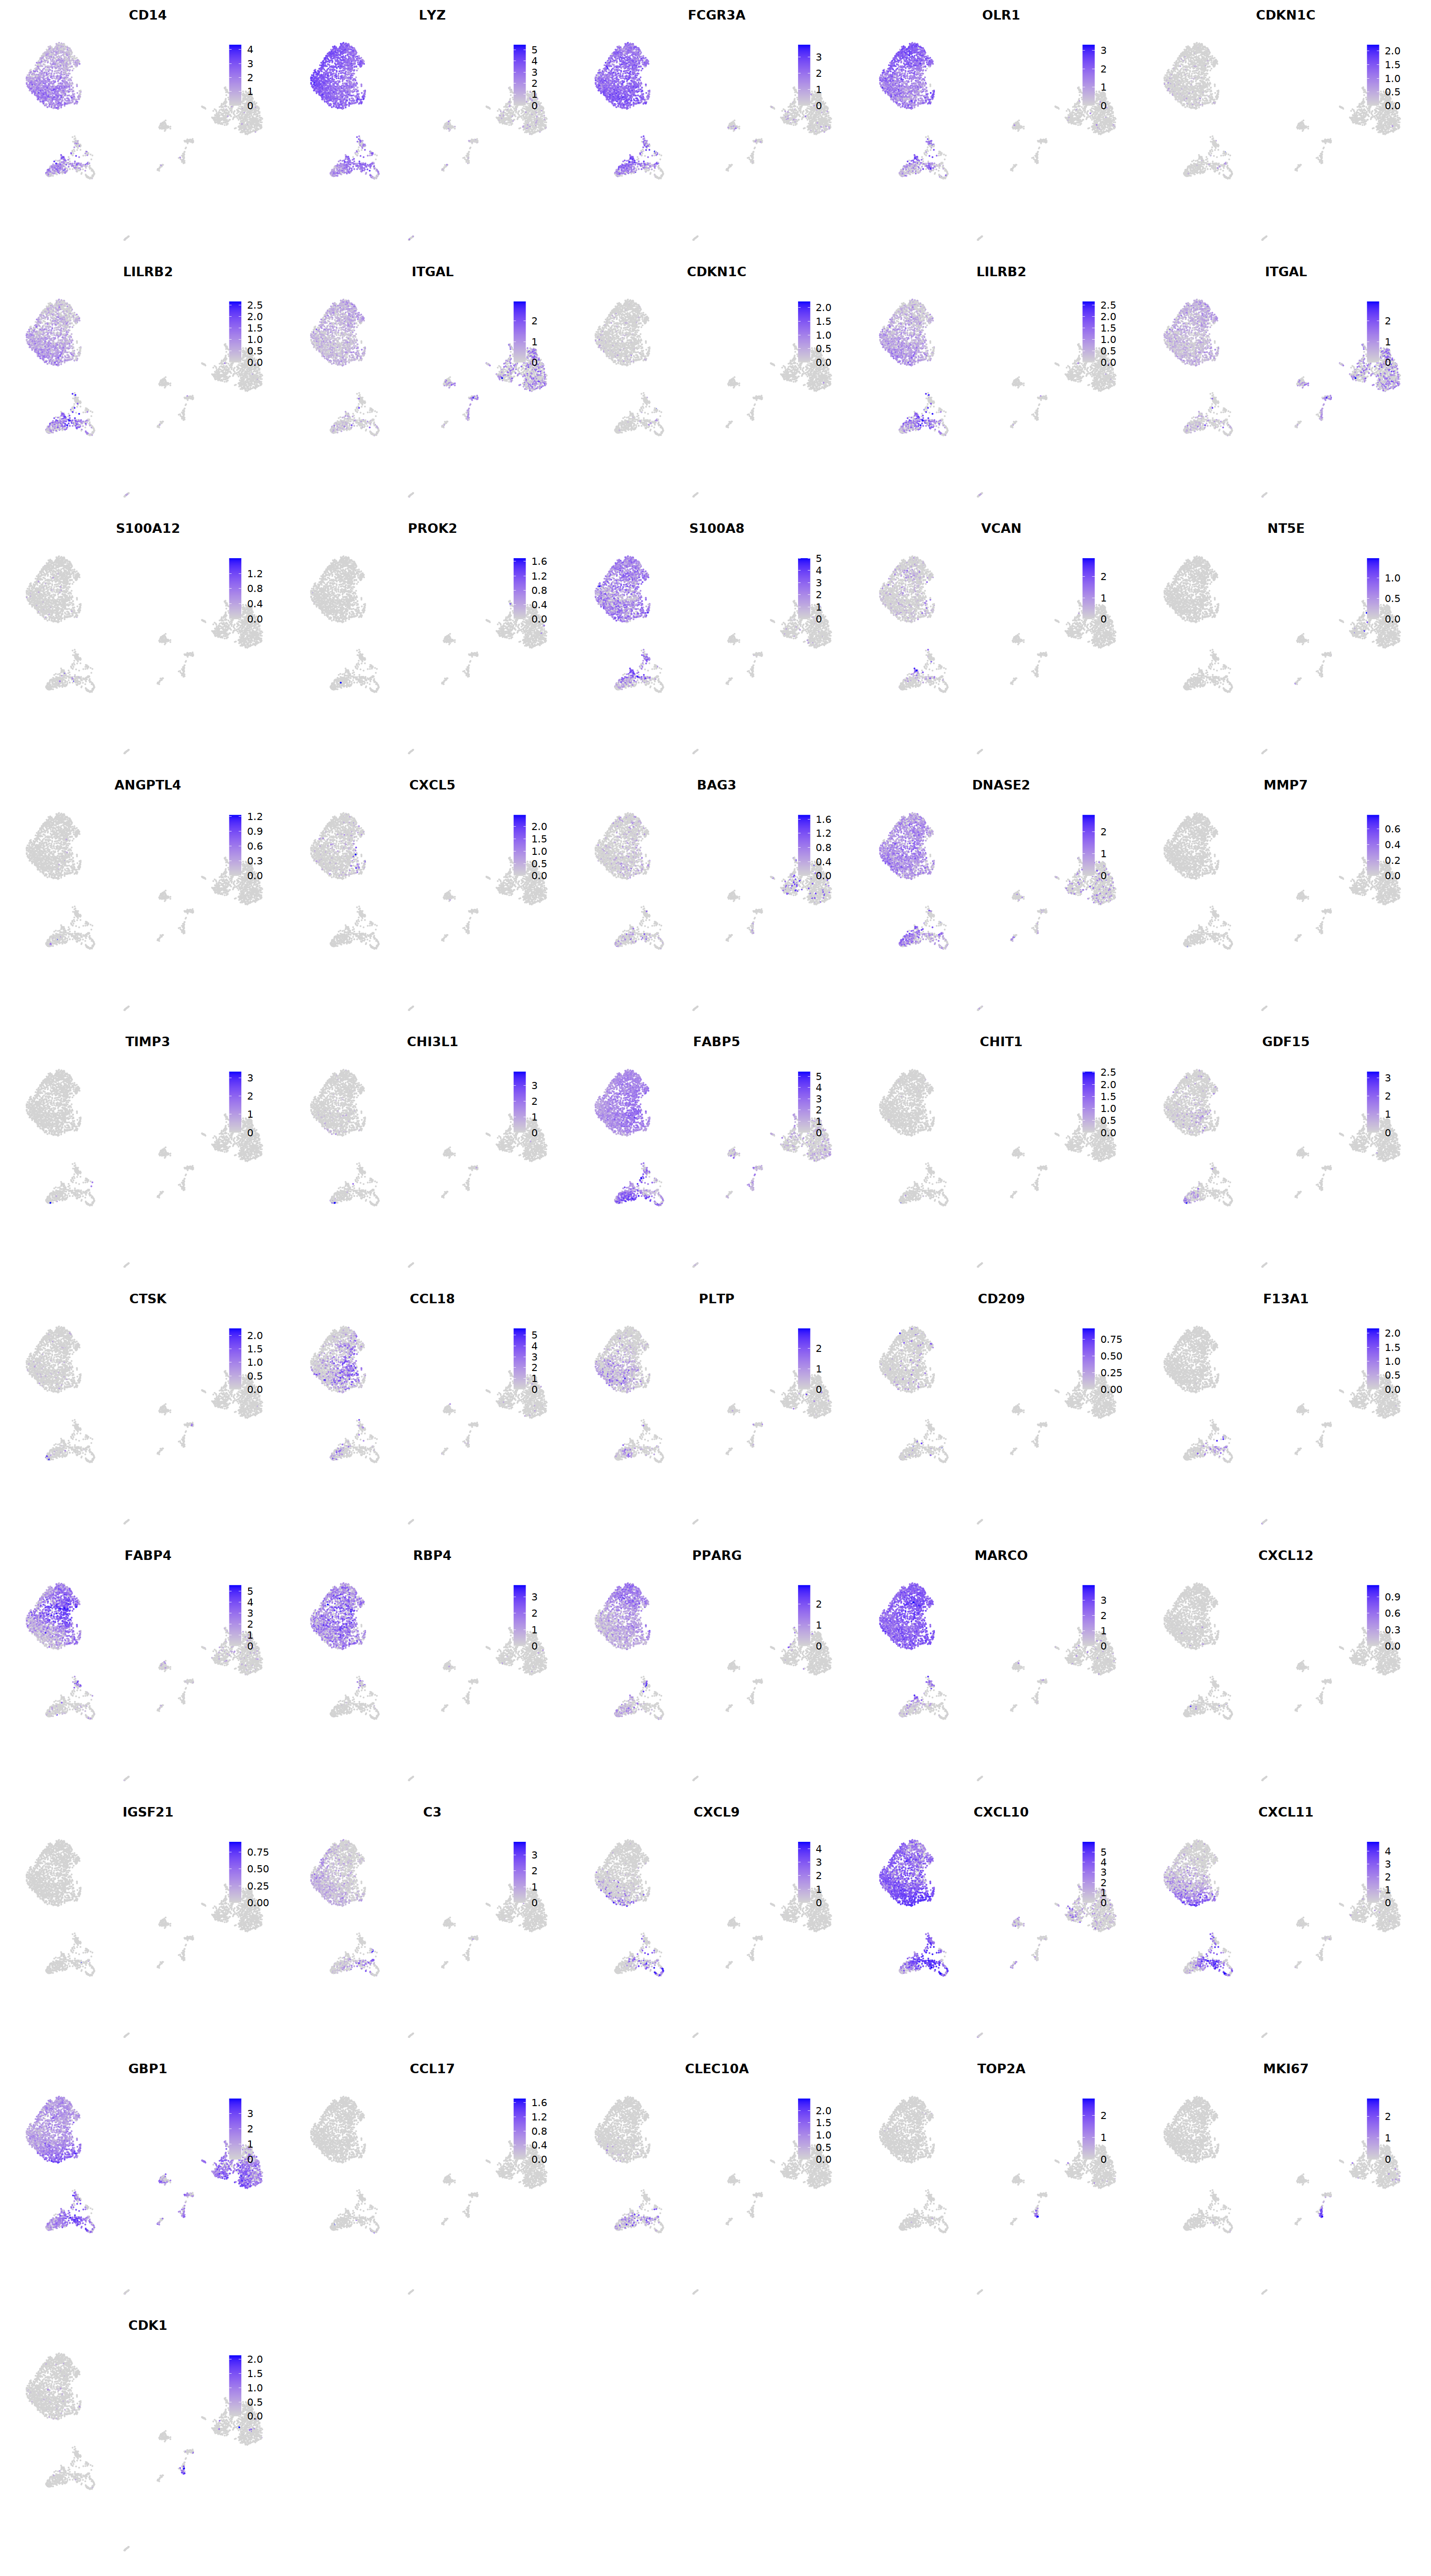
cell.sel = Cells(subset(seu, RNA_snn_res.0.9=='0'))
seu@meta.data[cell.sel, "persample_ann"] = 'macrophage'
cell.sel = Cells(subset(seu, RNA_snn_res.0.9=='1'))
seu@meta.data[cell.sel, "persample_ann"] = 'macrophage'
cell.sel = Cells(subset(seu, RNA_snn_res.0.9=='4'))
seu@meta.data[cell.sel, "persample_ann"] = 'macrophage'
cell.sel = Cells(subset(seu, RNA_snn_res.0.9=='7'))
seu@meta.data[cell.sel, "persample_ann"] = 'macrophage'

cell.sel = Cells(subset(seu, RNA_snn_res.0.9=='6'))
seu@meta.data[cell.sel, "persample_ann"] = 'macrophage'

cell.sel = Cells(subset(seu, RNA_snn_res.0.9=='9'))
seu@meta.data[cell.sel, "persample_ann"] = 'macrophage'
o(8,7);DimPlot(seu, group.by='persample_ann', label=T, repel=T, pt.size=0.1)
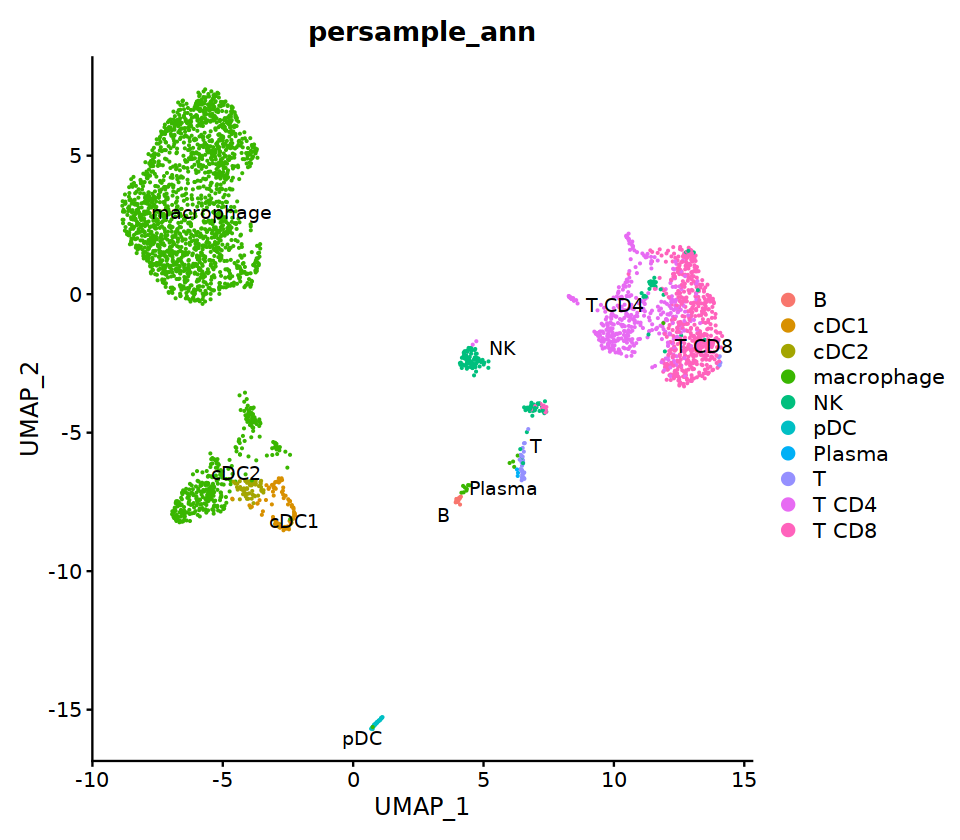
T
# T cell markers
o(5*5, 5*7)
FeaturePlot(seu, ncol = 5,pt.size=0.01,
features = c("CD3D","CD3E",'TRAC','TRBC1','TRGC2',
             'TRGC1','TRDC',"CD4",'CD8A','CD8B',
             'RORC','FOXP3','CD28','IL2RA',"CD44",
             'CD69','CD27','PRF1','GZMK','ID2',
             'RORC','GATA3','ZBTB16','IL7R','TBX21',
             'NKG7','GNLY','EOMES','KLRB1','TOX',
             "TOX2",'CXCR5','SELL','CD68','MT2A',
             'CST7','HOPX','GZMM','KLRD1','KLRC2',
             'KLRF1','KLRB1'), order=F)&theme(axis.line = element_blank(),
axis.title = element_blank(),axis.text = element_blank(), axis.ticks=element_blank()
)
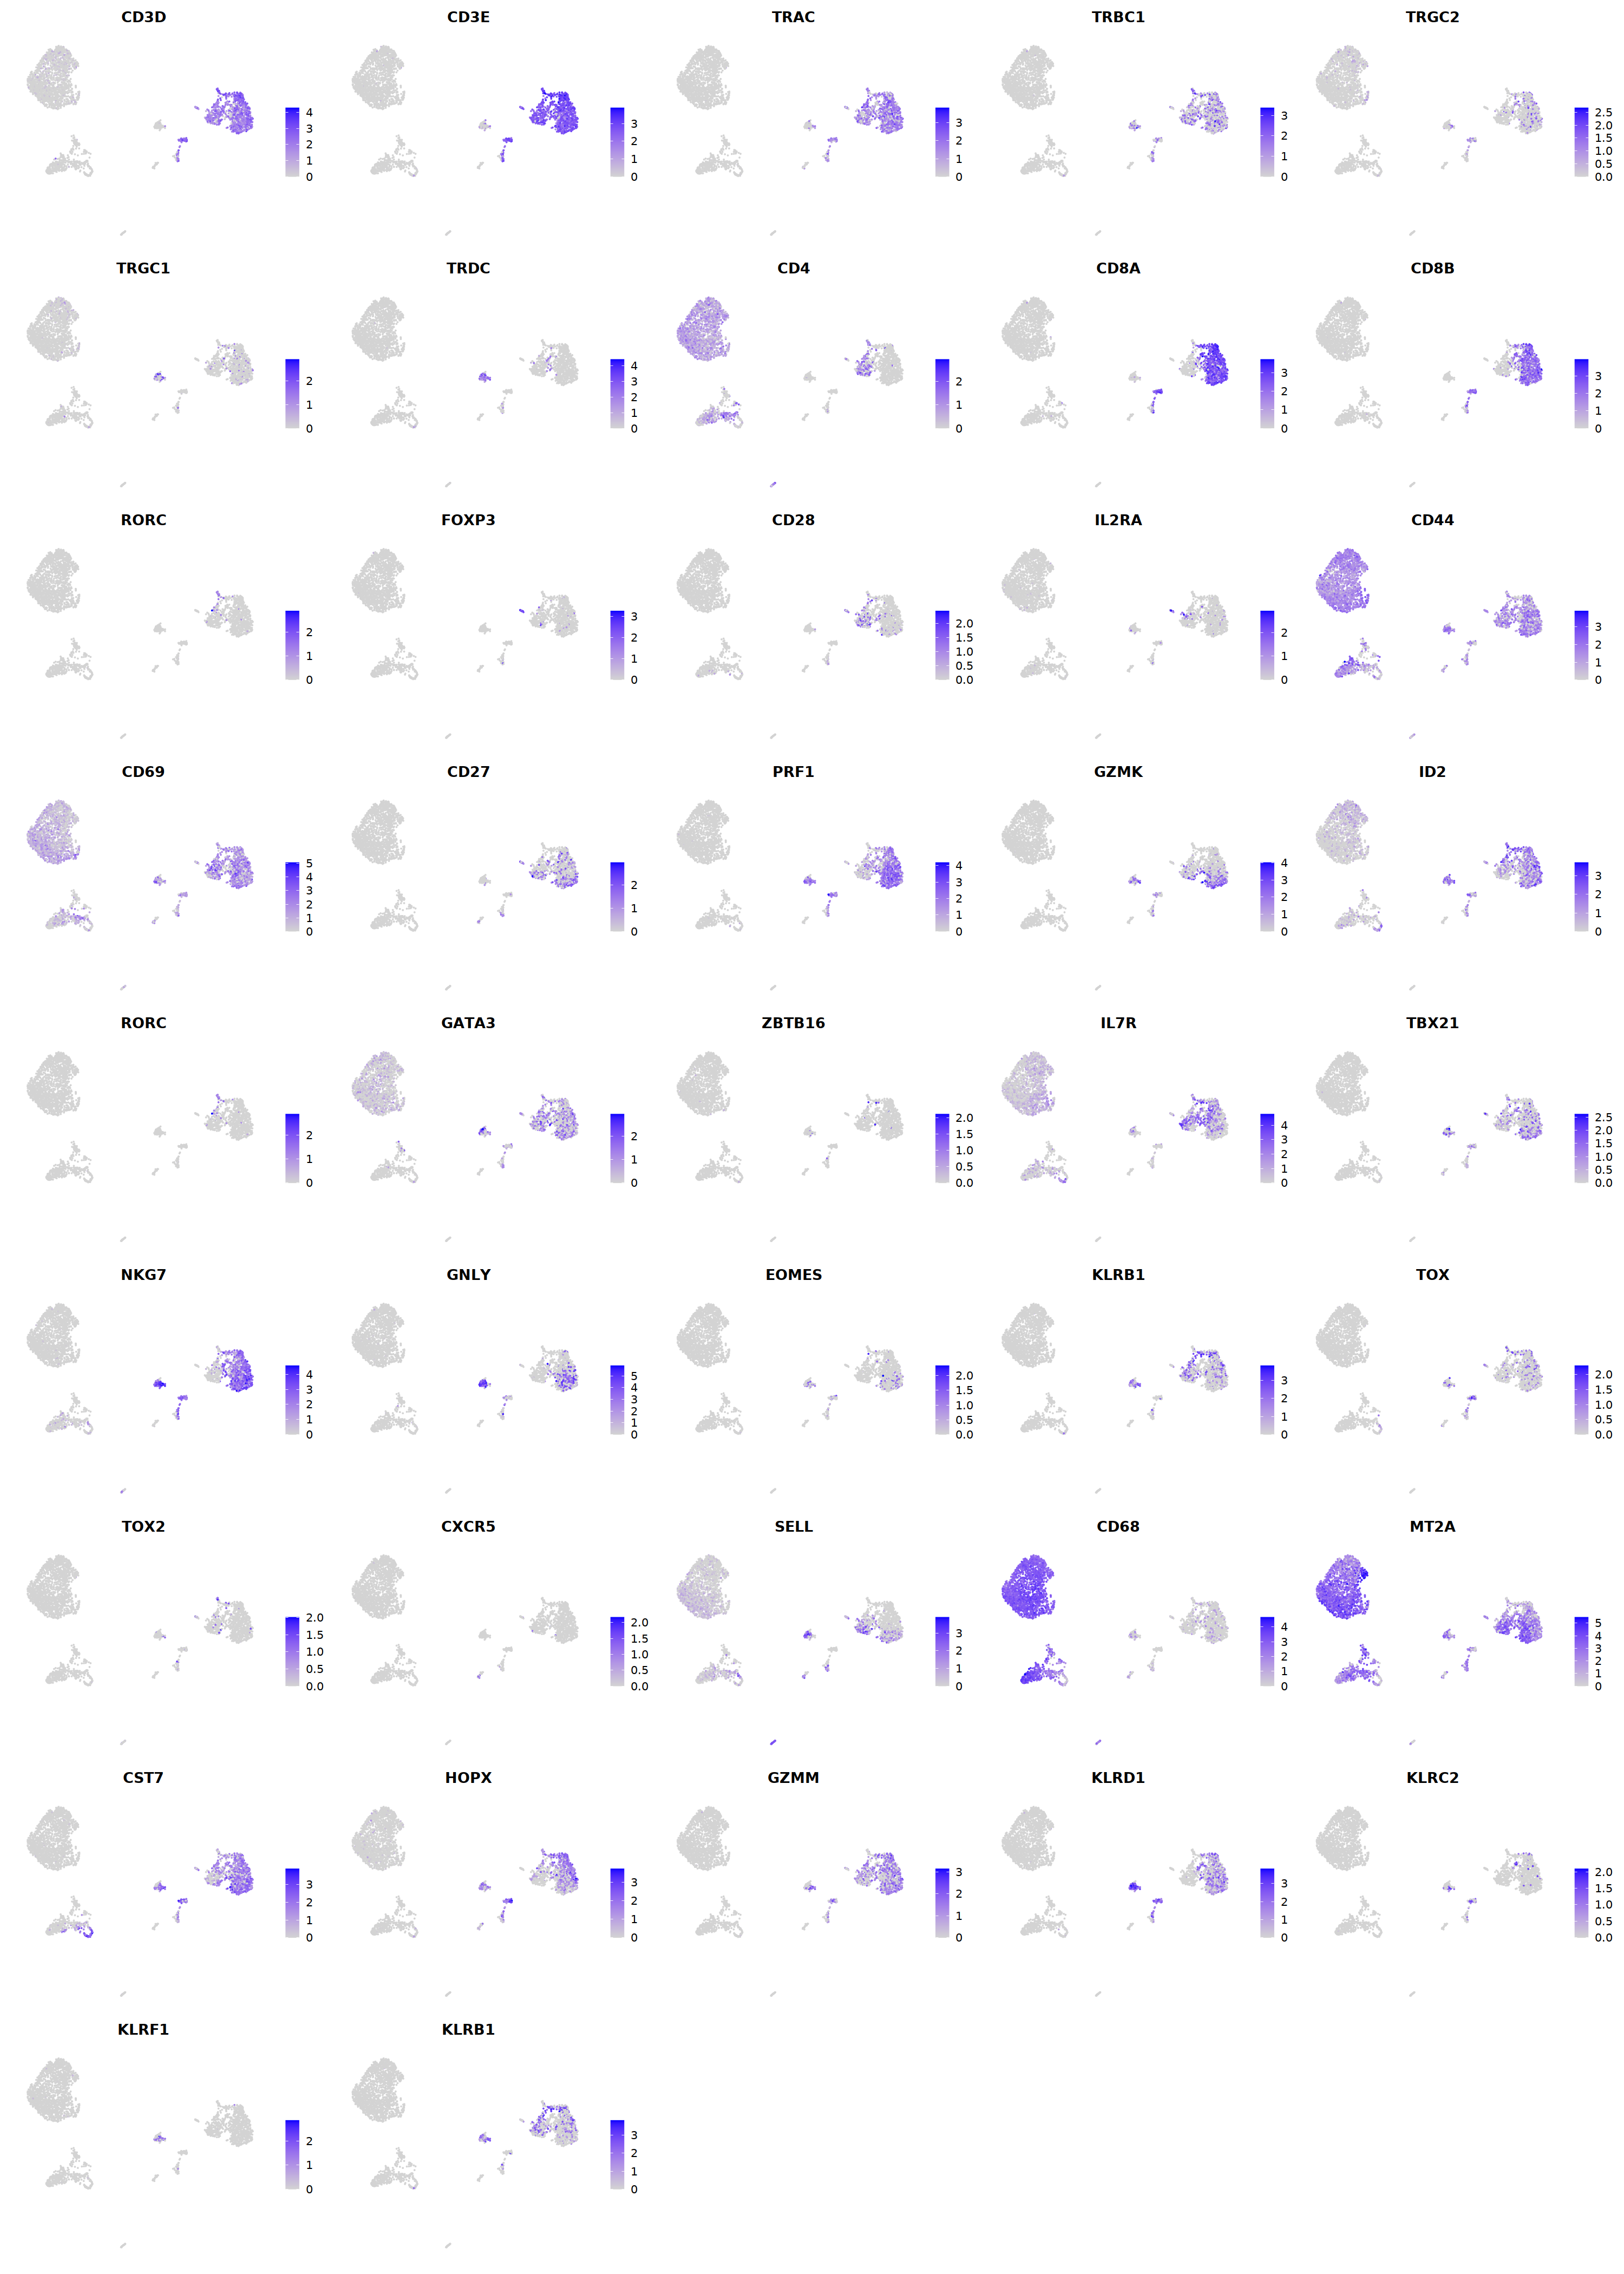
cell.sel = Cells(subset(seu, RNA_snn_res.0.9=='10'))
seu@meta.data[cell.sel, "persample_ann"] = 'NK'
# Treg
p=Nebulosa::plot_density(seu,c('CD3E','CD4','FOXP3'),joint=T)&theme(
    axis.title=element_blank(),axis.ticks=element_blank(),axis.text = element_blank())&NoLegend()

o(5*6, 5*1)
p+plot_layout(ncol = 6)

cell.sel = Cells(subset(seu, RNA_snn_res.0.9=='15'))
seu@meta.data[cell.sel, "persample_ann"] = 'Treg'
# CD8T
p=Nebulosa::plot_density(seu,c('CD3E','CD8A'),joint=T)&theme(
    axis.title=element_blank(),axis.ticks=element_blank(),axis.text = element_blank())&NoLegend()

o(5*6, 5*1)
p+plot_layout(ncol = 6)

cell.sel = Cells(subset(seu, RNA_snn_res.0.9=='2'))
seu@meta.data[cell.sel, "persample_ann"] = 'CD8 T'

cell.sel = Cells(subset(seu, RNA_snn_res.0.9=='3'))
seu@meta.data[cell.sel, "persample_ann"] = 'CD8 T'
gene_name= "SELL"
penalty = 4
expr    = seu@assays$RNA@data[gene_name,]
absence = exp(-expr*penalty)
seu@meta.data[, paste(gene_name,'lo',sep='_')] = absence

gene_name= "CCR7"
penalty = 4
expr    = seu@assays$RNA@data[gene_name,]
absence = exp(-expr*penalty)
seu@meta.data[, paste(gene_name,'lo',sep='_')] = absence

gene_name= "CD28"
penalty = 4
expr    = seu@assays$RNA@data[gene_name,]
absence = exp(-expr*penalty)
seu@meta.data[, paste(gene_name,'lo',sep='_')] = absence

gene_name= "CD44"
penalty = 4
expr    = seu@assays$RNA@data[gene_name,]
absence = exp(-expr*penalty)
seu@meta.data[, paste(gene_name,'lo',sep='_')] = absence

gene_name= "IL2RA"
penalty = 4
expr    = seu@assays$RNA@data[gene_name,]
absence = exp(-expr*penalty)
seu@meta.data[, paste(gene_name,'lo',sep='_')] = absence

gene_name= "CD69"
penalty = 4
expr    = seu@assays$RNA@data[gene_name,]
absence = exp(-expr*penalty)
seu@meta.data[, paste(gene_name,'lo',sep='_')] = absence
# Tcm
p=Nebulosa::plot_density(seu,c('SELL_lo','CD44','CCR7','CD28'),joint=T)&theme(
    axis.title=element_blank(),axis.ticks=element_blank(),axis.text = element_blank())&NoLegend()

o(5*6, 5*1)
p+plot_layout(ncol = 6)

# Tem
p=Nebulosa::plot_density(seu,c('SELL_lo','CD44','CCR7_lo','CD28'),joint=T)&theme(
    axis.title=element_blank(),axis.ticks=element_blank(),axis.text = element_blank())&NoLegend()

o(5*6, 5*1)
p+plot_layout(ncol = 6)

# Trm
p=Nebulosa::plot_density(seu,c('SELL_lo','CD44','CCR7_lo','ITGAE','CD69'),joint=T)&theme(
    axis.title=element_blank(),axis.ticks=element_blank(),axis.text = element_blank())&NoLegend()

o(5*6, 5*1)
p+plot_layout(ncol = 6)

# Naive T
p=Nebulosa::plot_density(seu,c('CD3E','CCR7','SELL',"IL2RG",'IL7R',
                               'CD44_lo','IL2RA_lo','CD69_lo'),joint=T)&theme(
    axis.title=element_blank(),axis.ticks=element_blank(),axis.text = element_blank())&NoLegend()

o(5*6, 5*2)
p+plot_layout(ncol = 6)
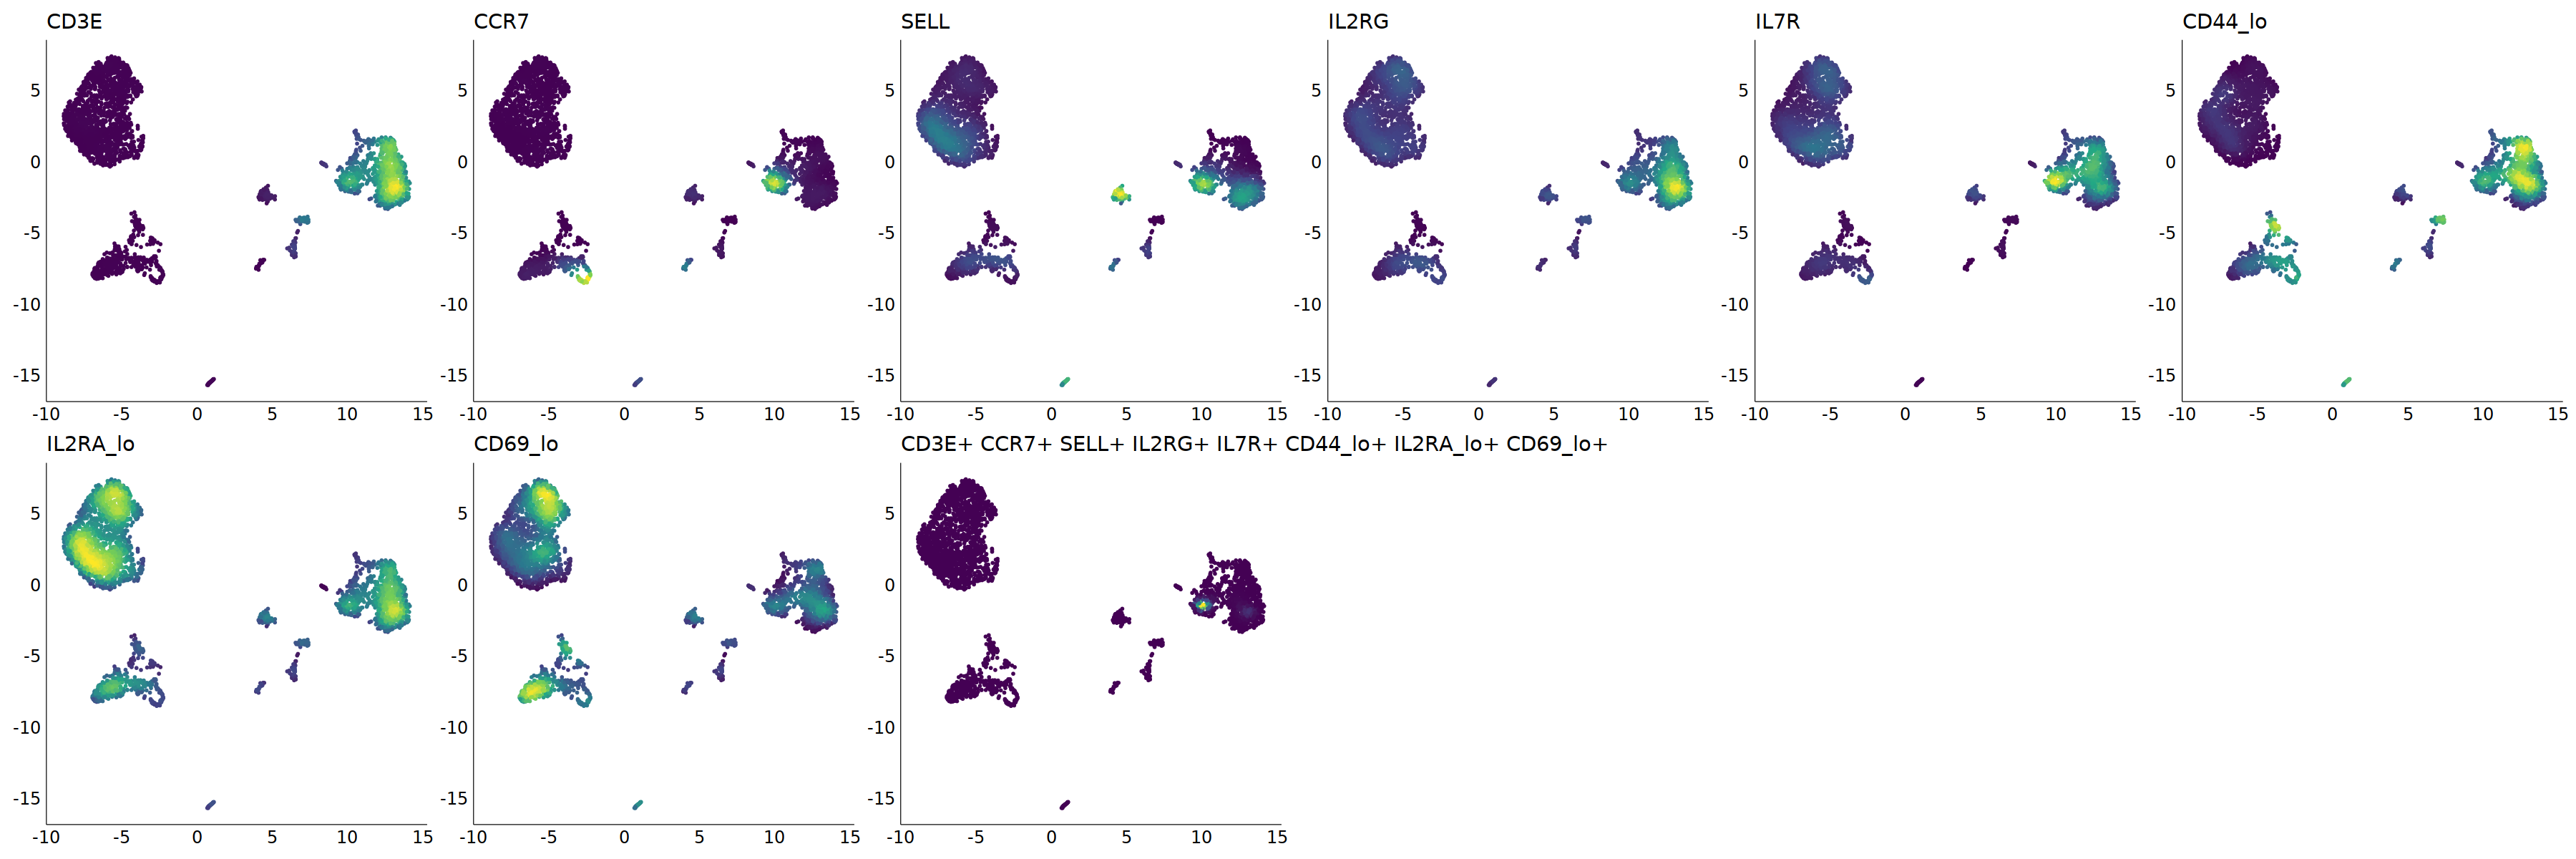
cell.sel = Cells(subset(seu, RNA_snn_res.0.9=='5'))
seu@meta.data[cell.sel, "persample_ann"] = 'CD4 T'
o(10,10)
DimPlot(seu, group.by='persample_ann', label=T)
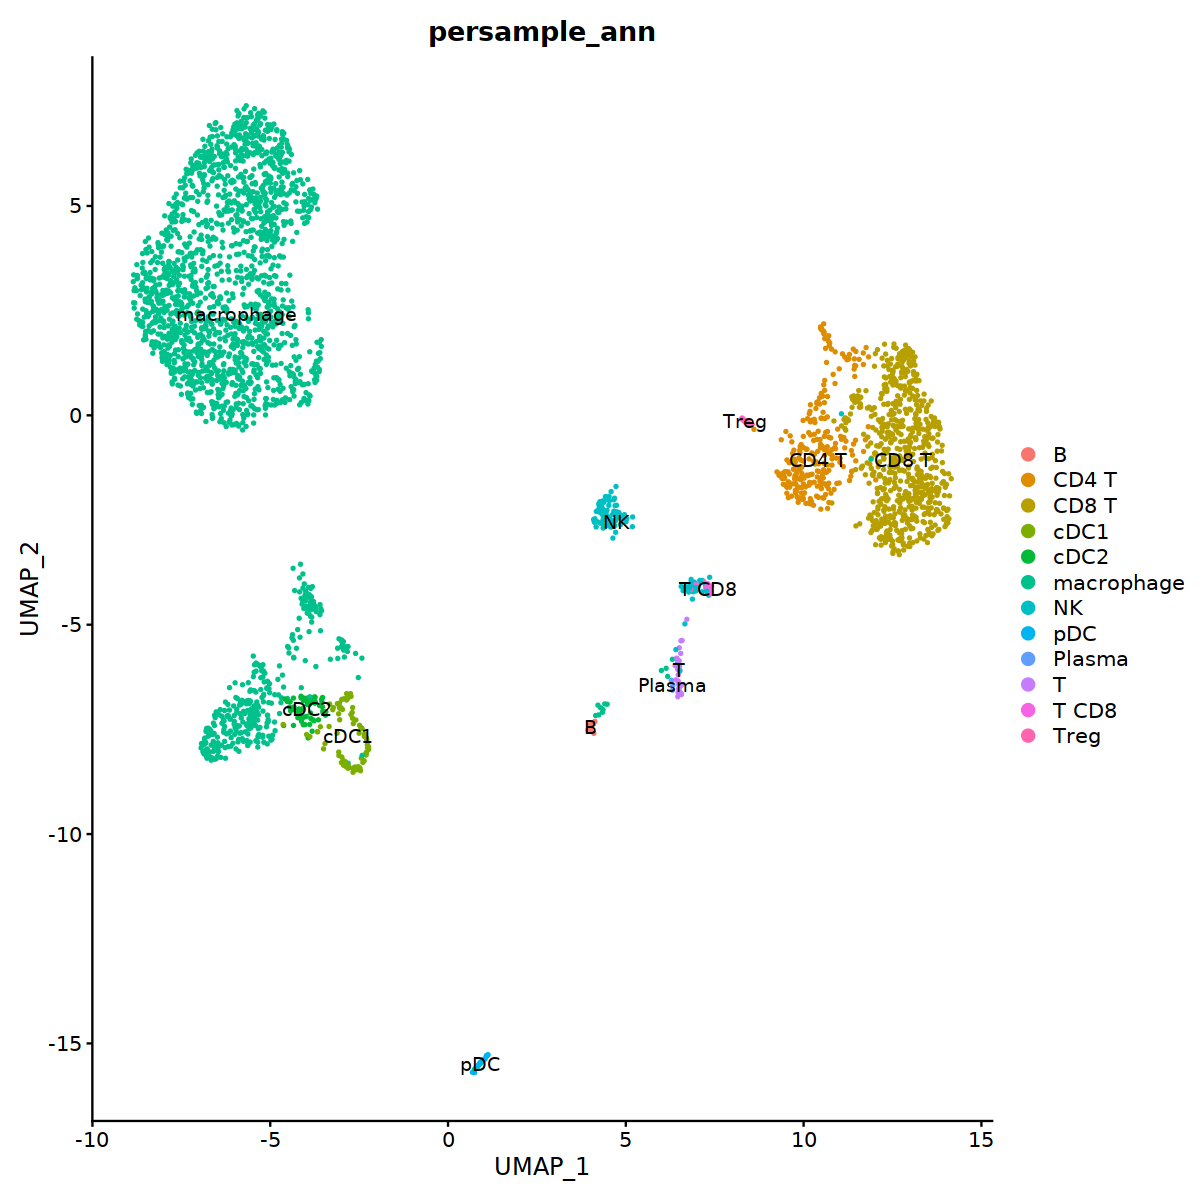
seu =subset(seu, persample_ann!='T')
o(5,5)
DimPlot(seu, group.by='persample_ann', label=T)

sample_name
seu -> immune.list[[sample_name]]
M2
# context switching
sample_name='M2'

seu= immune.list[[sample_name]]
group.by= 'RNA_snn_res.0.9'

Idents(seu)<-group.by
seu=FindSubCluster(seu, cluster='2',
                      graph.name="RNA_snn",
                      subcluster.name = "RNA_snn_res.0.9",  resolution = 0.6, algorithm = 1)

Idents(seu)<-group.by
seu=FindSubCluster(seu, cluster='8',
                      graph.name="RNA_snn",
                      subcluster.name = "RNA_snn_res.0.9",  resolution = 0.3, algorithm = 1)


o(17,8)
ggarrange(
    DimPlot(seu, group.by=group.by, label=T,repel=T, label.size = 5),
    DimPlot(seu, group.by='integrated_ann',  label=T,repel=T, label.size = 5),
    nrow=1, ncol=2
)
Modularity Optimizer version 1.3.0 by Ludo Waltman and Nees Jan van Eck

Number of nodes: 343
Number of edges: 11264

Running Louvain algorithm...
Maximum modularity in 10 random starts: 0.6580
Number of communities: 4
Elapsed time: 0 seconds
Modularity Optimizer version 1.3.0 by Ludo Waltman and Nees Jan van Eck

Number of nodes: 89
Number of edges: 2252

Running Louvain algorithm...
Maximum modularity in 10 random starts: 0.7087
Number of communities: 2
Elapsed time: 0 seconds
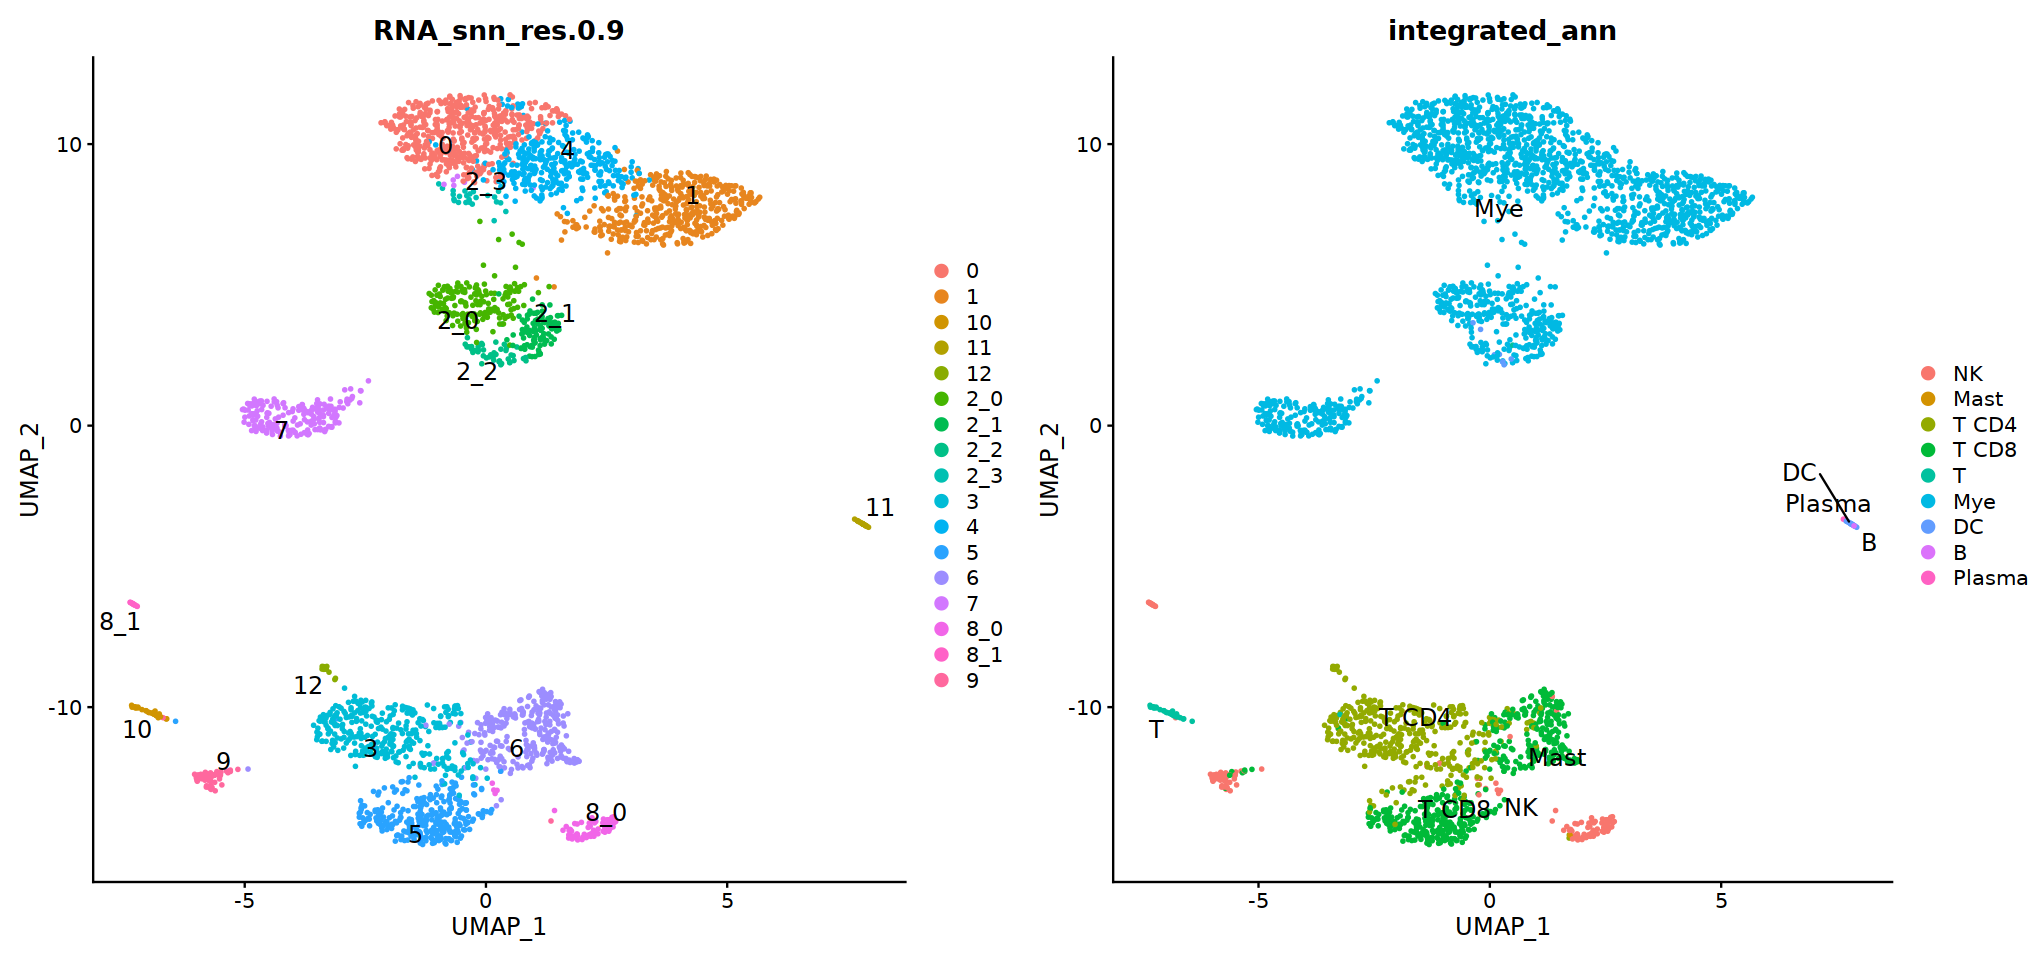
DC
# cDC1
p=Nebulosa::plot_density(seu,c('HLA-DQA1','BATF3','CADM1','CLEC9A','XCR1'),joint=T)&theme(
    axis.title=element_blank(),axis.ticks=element_blank(),axis.text = element_blank())&NoLegend()

o(5*6, 5*1)
p+plot_layout(ncol = 6)

cell.sel = Cells(subset(seu, RNA_snn_res.0.9=='2_1'))
seu@meta.data[cell.sel, "persample_ann"] = 'cDC1'
# cDC2
p=Nebulosa::plot_density(seu,c('CD14','PLD4','CD1C','CX3CR1','CLEC10A'),joint=T)&theme(
    axis.title=element_blank(),axis.ticks=element_blank(),axis.text = element_blank())&NoLegend()

o(5*6, 5*1)
p+plot_layout(ncol = 6)

cell.sel = Cells(subset(seu, RNA_snn_res.0.9=='2_2'))
seu@meta.data[cell.sel, "persample_ann"] = 'cDC2'
# pDC
p=Nebulosa::plot_density(seu,c('CLEC4C','IRF4','LILRA4','LILRB4','IRF8'),joint=T)&theme(
    axis.title=element_blank(),axis.ticks=element_blank(),axis.text = element_blank())&NoLegend()

o(5*6, 5*1)
p+plot_layout(ncol = 6)

# 11 is pDC

cell.sel = Cells(subset(seu, RNA_snn_res.0.9=='11'))
seu@meta.data[cell.sel, "persample_ann"] = 'pDC'
# moDC
p=Nebulosa::plot_density(seu,c('CD14','CD1A','CD1C','FCER1A'),joint=T)&theme(
    axis.title=element_blank(),axis.ticks=element_blank(),axis.text = element_blank())&NoLegend()

o(5*6, 5*1)
p+plot_layout(ncol = 6)

# 5_1 is moDC

# DC markers
o(5*5, 5*4)
FeaturePlot(seu, ncol = 5,pt.size=0.01,
            features = c('CST3','FCER1A','ITGAX',# pan DC
                         'LAMP3','CLEC9A',#cDC1
                         "CD1C",'HLA-DQA1',"PLD4",# cDC2
                         'LILRA4','LILRB4','IRF8','CCR7', #pDC
                         'CCL17','CD163','CD14','FCER1A','CD1A','MRC1'#moDC
                        )
           )&theme(
legend.position=c(0.8,0.8),
axis.line = element_blank(),
axis.title = element_blank(),axis.text = element_blank(), axis.ticks=element_blank()
)
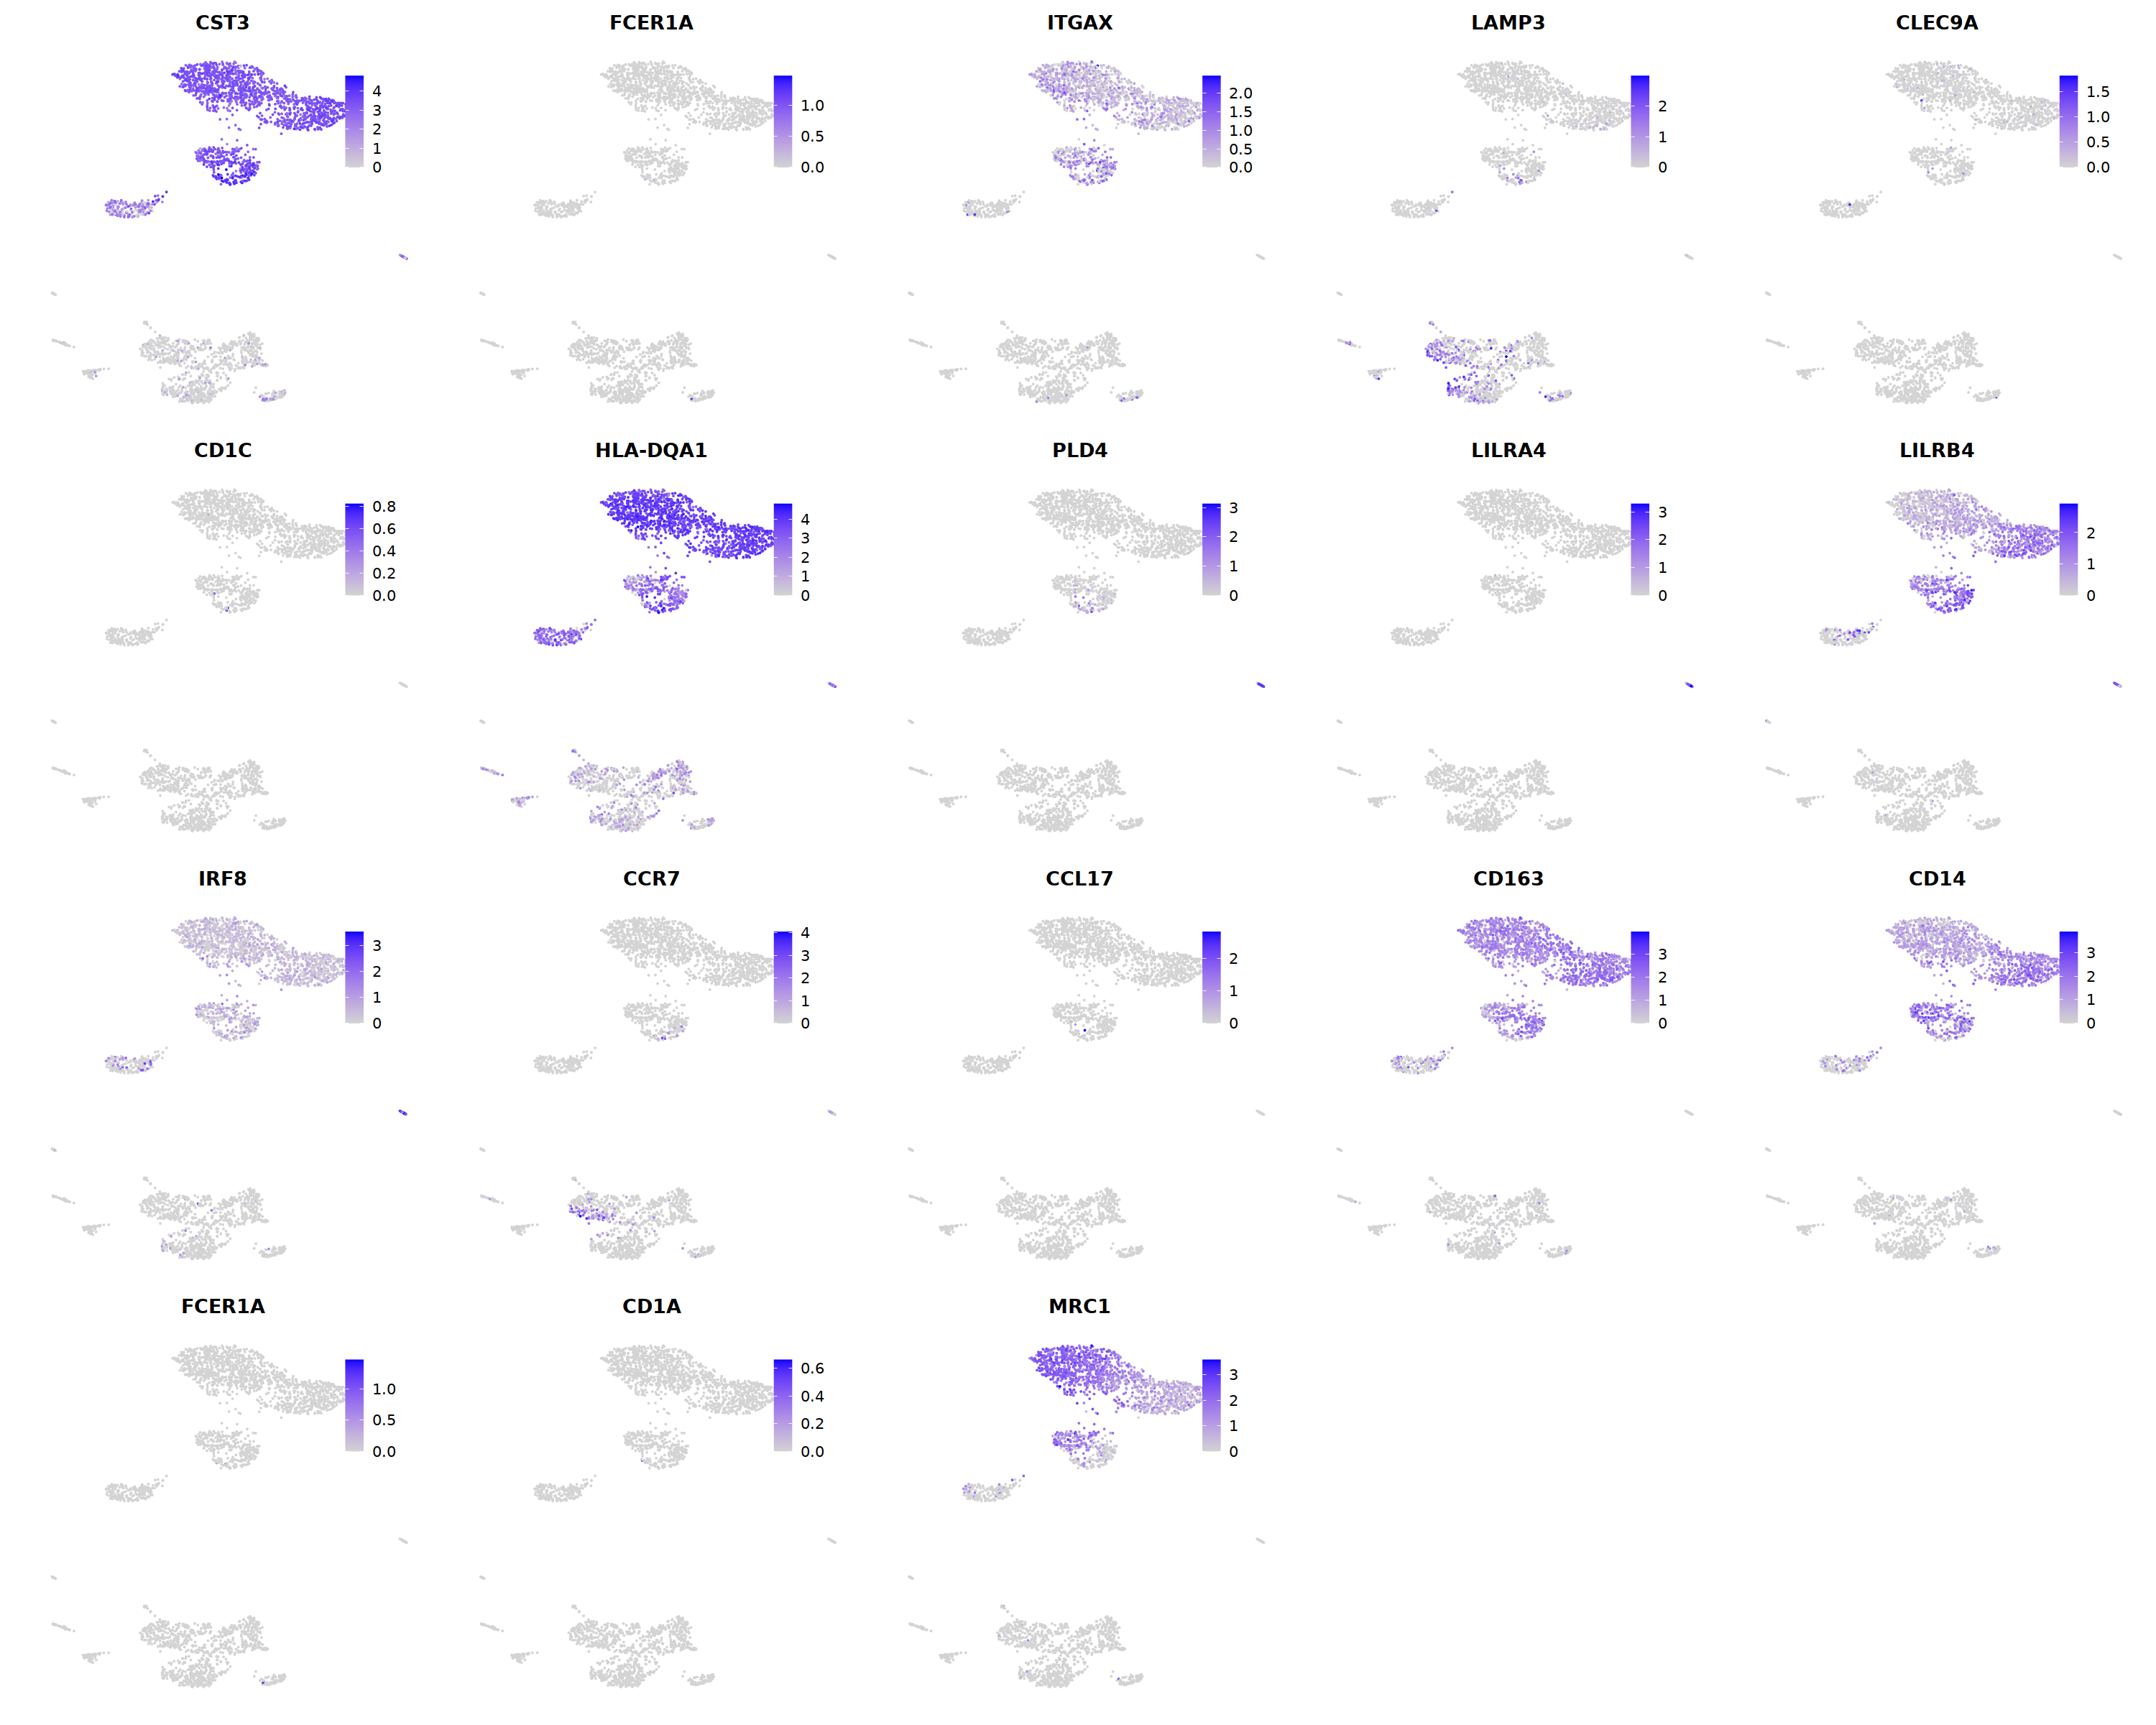
Mac
# macrophages
o(5*5, 5*9)
FeaturePlot(seu, ncol = 5, pt.size=0.01,
            features = c("CD14",'LYZ',"FCGR3A",
'OLR1','CDKN1C','LILRB2',"ITGAL",
'CDKN1C','LILRB2','ITGAL',
'S100A12','PROK2','S100A8','VCAN',
'NT5E','ANGPTL4','CXCL5','BAG3',
'DNASE2',
'MMP7','TIMP3','CHI3L1','FABP5',
'CHIT1','GDF15','CTSK',
'CCL18','PLTP','CD209','F13A1',
'FABP4','RBP4','PPARG','MARCO',
'CXCL12','IGSF21','C3',
'CXCL9','CXCL10','CXCL11','GBP1',
'CCL17',"CLEC10A",
"TOP2A","MKI67",'CDK1')
)&theme(
legend.position=c(0.8,0.8),
axis.line = element_blank(),
axis.title = element_blank(),axis.text = element_blank(), axis.ticks=element_blank()
)
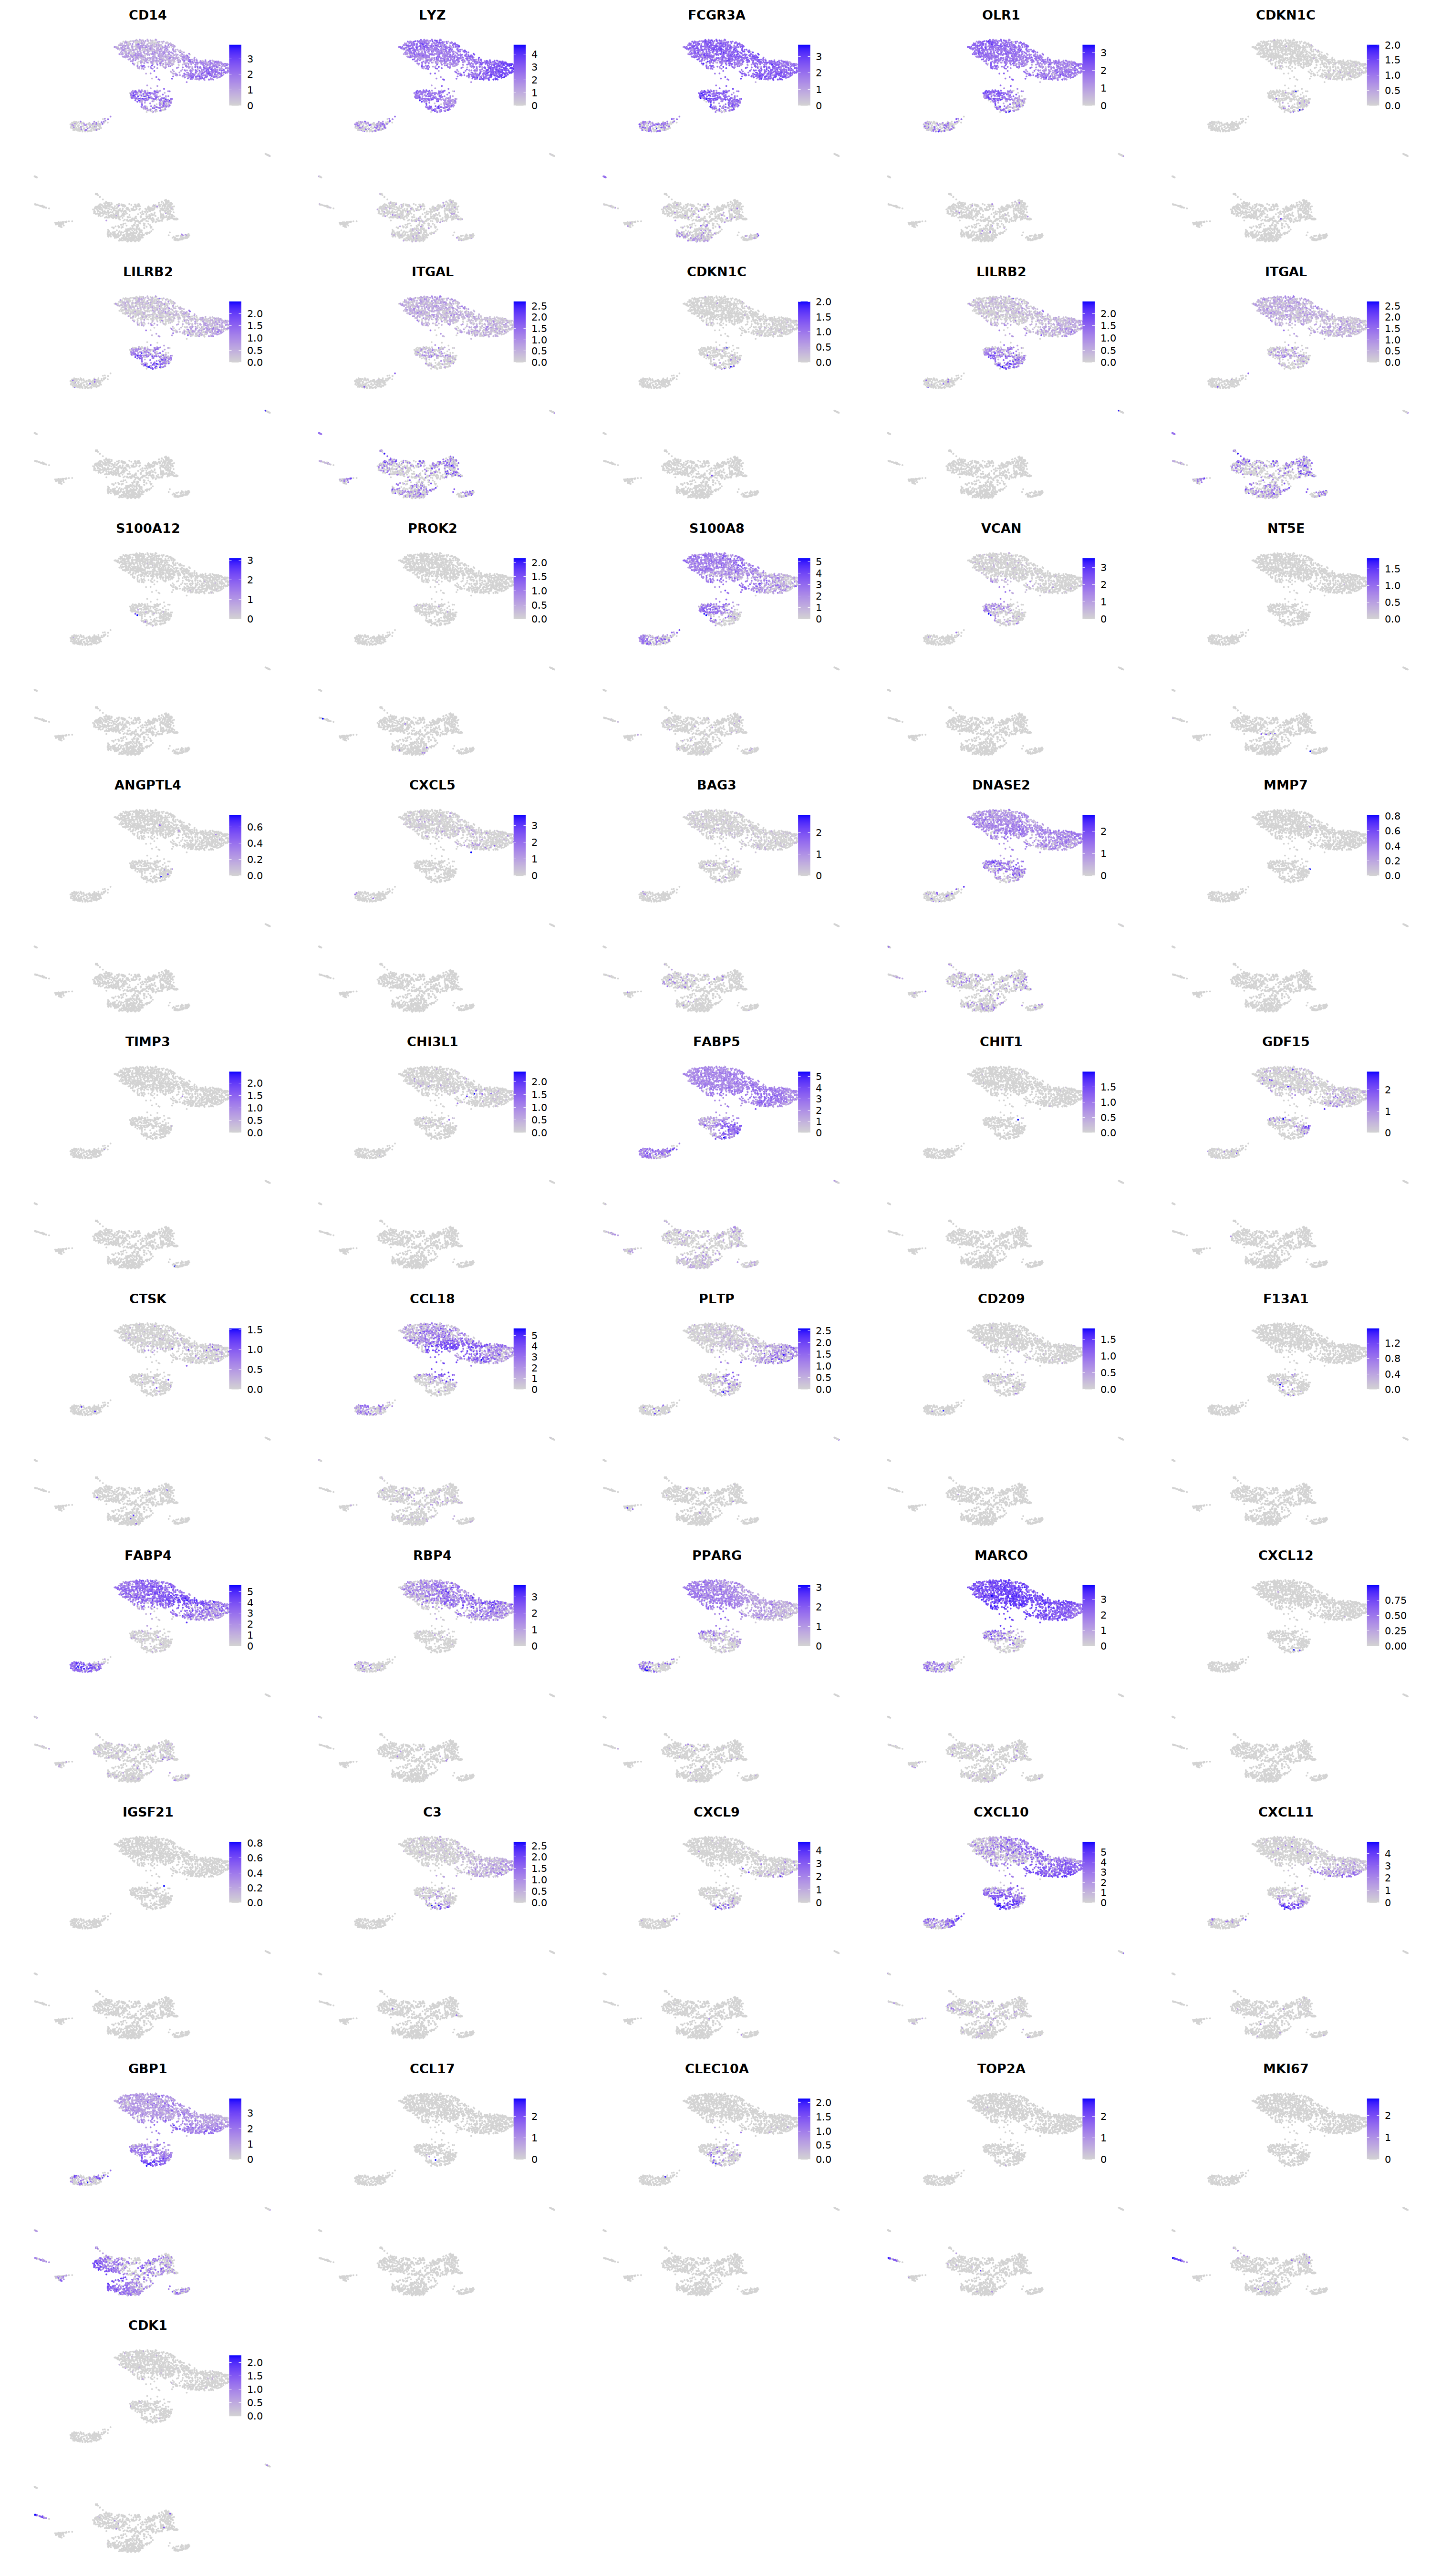
cell.sel = Cells(subset(seu, RNA_snn_res.0.9=='0'))
seu@meta.data[cell.sel, "persample_ann"] = 'macrophage'

cell.sel = Cells(subset(seu, RNA_snn_res.0.9=='1'))
seu@meta.data[cell.sel, "persample_ann"] = 'macrophage'

cell.sel = Cells(subset(seu, RNA_snn_res.0.9=='4'))
seu@meta.data[cell.sel, "persample_ann"] = 'macrophage'

cell.sel = Cells(subset(seu, RNA_snn_res.0.9=='2_0'))
seu@meta.data[cell.sel, "persample_ann"] = 'macrophage'

cell.sel = Cells(subset(seu, RNA_snn_res.0.9=='2_3'))
seu@meta.data[cell.sel, "persample_ann"] = 'macrophage'

cell.sel = Cells(subset(seu, RNA_snn_res.0.9=='7'))
seu@meta.data[cell.sel, "persample_ann"] = 'macrophage'
T
# Treg
p=Nebulosa::plot_density(seu,c('CD3E','CD4','FOXP3'),joint=T)&theme(
    axis.title=element_blank(),axis.ticks=element_blank(),axis.text = element_blank())&NoLegend()

o(5*6, 5*1)
p+plot_layout(ncol = 6)

cell.sel = Cells(subset(seu, RNA_snn_res.0.9=='12'))
seu@meta.data[cell.sel, "persample_ann"] = 'Treg'
o(8,7);DimPlot(seu, group.by='RNA_snn_res.0.9', label=T, repel=T, pt.size=0.1)
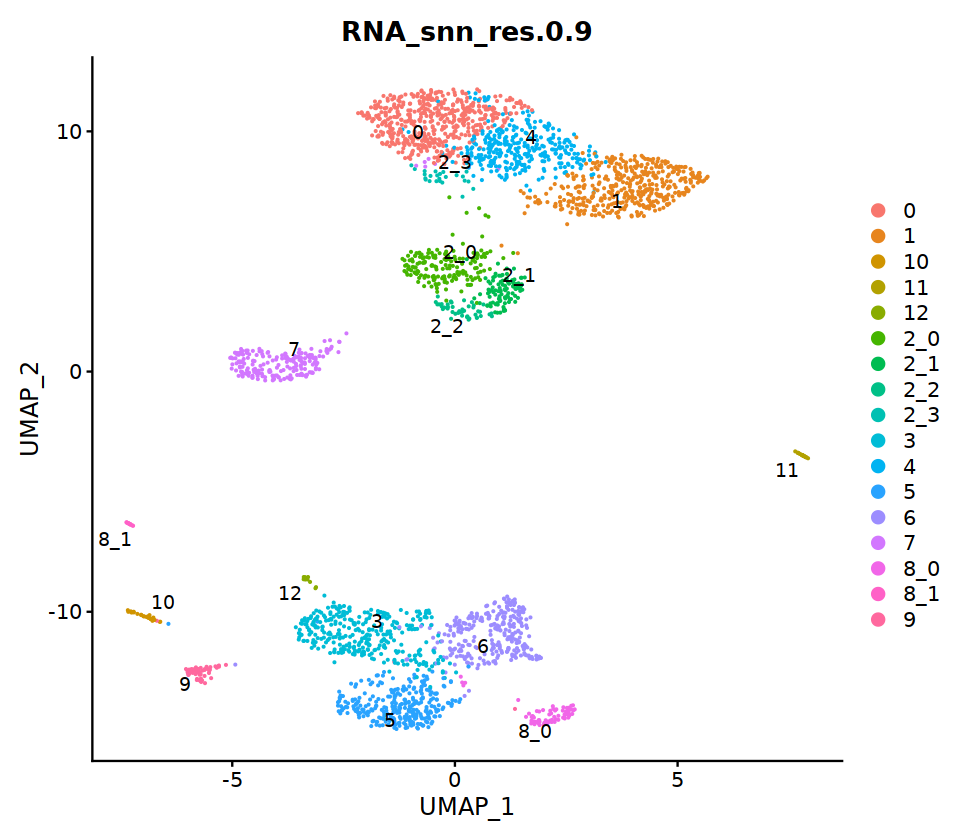
# CD8T
p=Nebulosa::plot_density(seu,c('CD3E','CD8A'),joint=T)&theme(
    axis.title=element_blank(),axis.ticks=element_blank(),axis.text = element_blank())&NoLegend()

o(5*6, 5*1)
p+plot_layout(ncol = 6)

cell.sel = Cells(subset(seu, RNA_snn_res.0.9=='5'))
seu@meta.data[cell.sel, "persample_ann"] = 'CD8 cytotoxic T'

cell.sel = Cells(subset(seu, RNA_snn_res.0.9=='6'))
seu@meta.data[cell.sel, "persample_ann"] = 'CD8 cytotoxic T'
cell.sel = Cells(subset(seu, RNA_snn_res.0.9=='8_0'))
seu@meta.data[cell.sel, "persample_ann"] = 'NK'
cell.sel = Cells(subset(seu, RNA_snn_res.0.9=='8_1'))
seu@meta.data[cell.sel, "persample_ann"] = 'gdT'
cell.sel = Cells(subset(seu, RNA_snn_res.0.9=='9'))
seu@meta.data[cell.sel, "persample_ann"] = 'gdT'
cell.sel = Cells(subset(seu, RNA_snn_res.0.9=='10'))
seu@meta.data[cell.sel, "persample_ann"] = 'T cycling'
gene_name= "SELL"
penalty = 4
expr    = seu@assays$RNA@data[gene_name,]
absence = exp(-expr*penalty)
seu@meta.data[, paste(gene_name,'lo',sep='_')] = absence

gene_name= "CCR7"
penalty = 4
expr    = seu@assays$RNA@data[gene_name,]
absence = exp(-expr*penalty)
seu@meta.data[, paste(gene_name,'lo',sep='_')] = absence

gene_name= "CD28"
penalty = 4
expr    = seu@assays$RNA@data[gene_name,]
absence = exp(-expr*penalty)
seu@meta.data[, paste(gene_name,'lo',sep='_')] = absence

gene_name= "CD44"
penalty = 4
expr    = seu@assays$RNA@data[gene_name,]
absence = exp(-expr*penalty)
seu@meta.data[, paste(gene_name,'lo',sep='_')] = absence

gene_name= "IL2RA"
penalty = 4
expr    = seu@assays$RNA@data[gene_name,]
absence = exp(-expr*penalty)
seu@meta.data[, paste(gene_name,'lo',sep='_')] = absence

gene_name= "CD69"
penalty = 4
expr    = seu@assays$RNA@data[gene_name,]
absence = exp(-expr*penalty)
seu@meta.data[, paste(gene_name,'lo',sep='_')] = absence
# Tcm
p=Nebulosa::plot_density(seu,c('SELL_lo','CD44','CCR7','CD28'),joint=T)&theme(
    axis.title=element_blank(),axis.ticks=element_blank(),axis.text = element_blank())&NoLegend()

o(5*6, 5*1)
p+plot_layout(ncol = 6)

# Tem
p=Nebulosa::plot_density(seu,c('SELL_lo','CD44','CCR7_lo','CD28'),joint=T)&theme(
    axis.title=element_blank(),axis.ticks=element_blank(),axis.text = element_blank())&NoLegend()

o(5*6, 5*1)
p+plot_layout(ncol = 6)

# Trm
p=Nebulosa::plot_density(seu,c('SELL_lo','CD44','CCR7_lo','ITGAE','CD69'),joint=T)&theme(
    axis.title=element_blank(),axis.ticks=element_blank(),axis.text = element_blank())&NoLegend()

o(5*6, 5*1)
p+plot_layout(ncol = 6)

# Naive T
p=Nebulosa::plot_density(seu,c('CD3E','CCR7','SELL',"IL2RG",'IL7R',
                               'CD44_lo','IL2RA_lo','CD69_lo'),joint=T)&theme(
    axis.title=element_blank(),axis.ticks=element_blank(),axis.text = element_blank())&NoLegend()

o(5*6, 5*2)
p+plot_layout(ncol = 6)
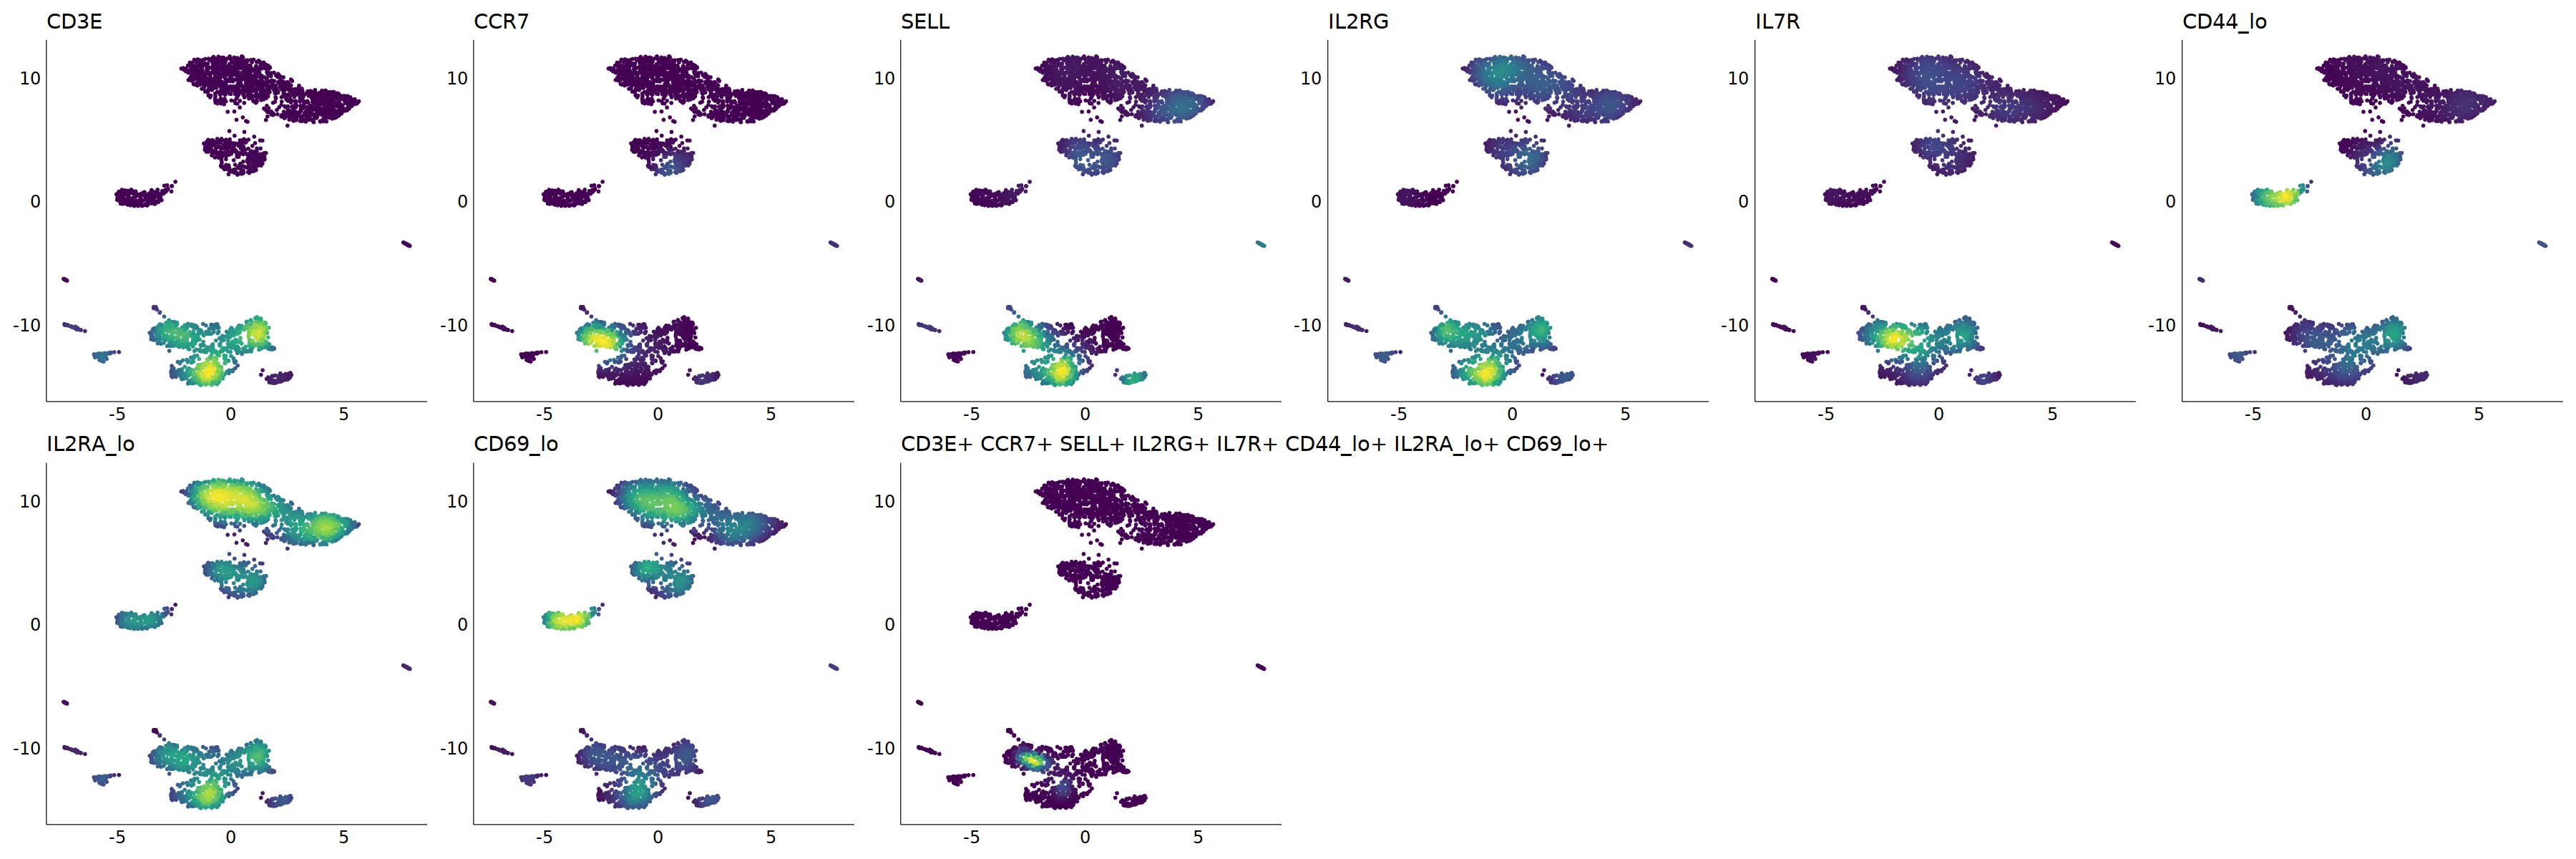
cell.sel = Cells(subset(seu, RNA_snn_res.0.9=='3'))
seu@meta.data[cell.sel, "persample_ann"] = 'T CD4'
# T cell markers
o(5*5, 5*7)
FeaturePlot(seu, ncol = 5,pt.size=0.01,
features = c("CD3D","CD3E",'TRAC','TRBC1','TRGC2',
             'TRGC1','TRDC',"CD4",'CD8A','CD8B',
             'RORC','FOXP3','CD28','IL2RA',"CD44",
             'CD69','CD27','PRF1','GZMK','ID2',
             'RORC','GATA3','ZBTB16','IL7R','TBX21',
             'NKG7','GNLY','EOMES','KLRB1','TOX',
             "TOX2",'CXCR5','SELL','CD68','MT2A',
             'CST7','HOPX','GZMM','KLRD1','KLRC2',
             'KLRF1'), order=F)&theme(axis.line = element_blank(),
axis.title = element_blank(),axis.text = element_blank(), axis.ticks=element_blank()
)
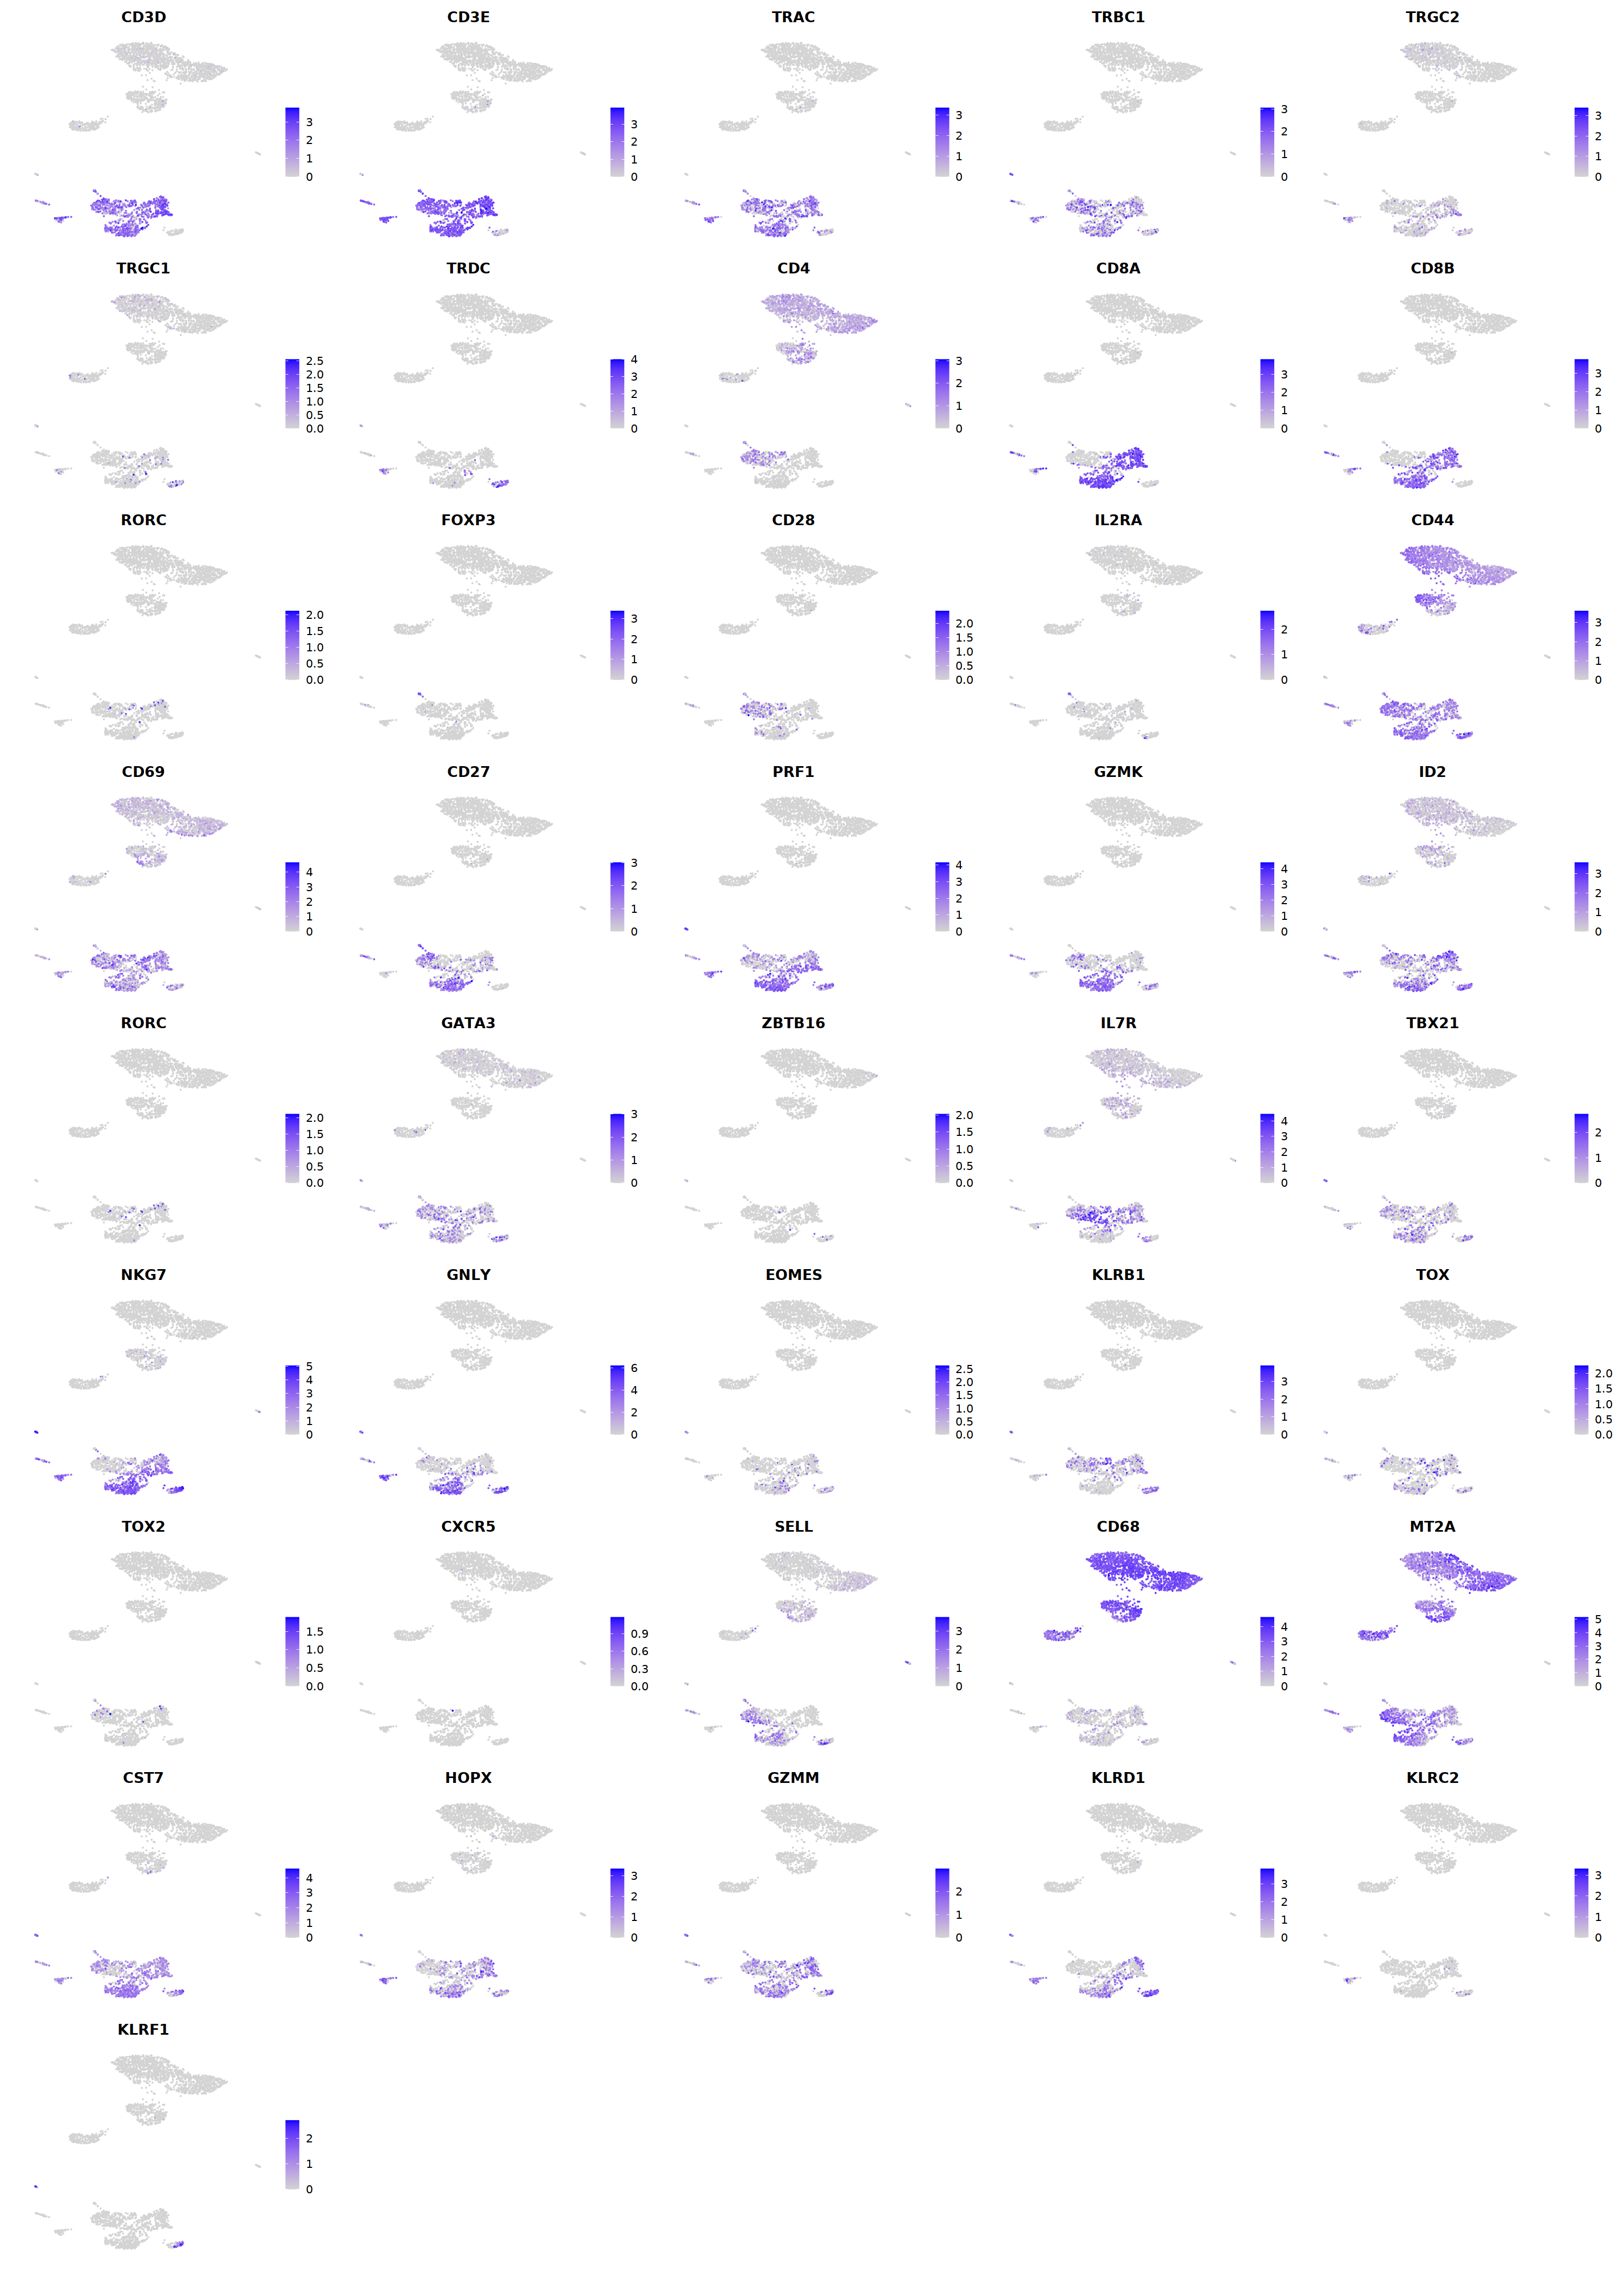
o(8,7);DimPlot(seu, group.by='persample_ann', label=T, repel=T, pt.size=0.1)
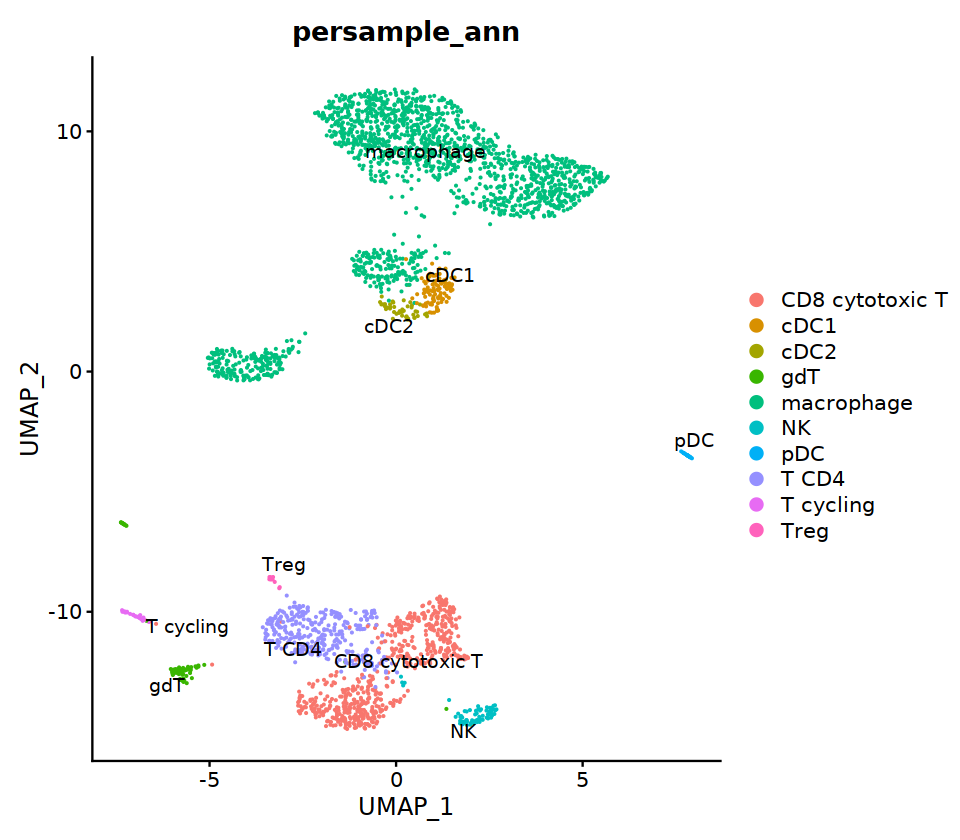
sample_name
seu -> immune.list[[sample_name]]
S1
# context switching
sample_name='S1'

seu= immune.list[[sample_name]]
group.by= 'RNA_snn_res.0.9'

Idents(seu)<-group.by
seu=FindSubCluster(seu, cluster='13',
                      graph.name="RNA_snn",
                      subcluster.name = "RNA_snn_res.0.9",  resolution = 0.6, algorithm = 1)

Idents(seu) <- group.by
seu=FindSubCluster(seu, cluster='7',
                      graph.name="RNA_snn",
                      subcluster.name = "RNA_snn_res.0.9",  resolution = 0.3, algorithm = 1)
Idents(seu) <- group.by
seu=FindSubCluster(seu, cluster='8',
                      graph.name="RNA_snn",
                      subcluster.name = "RNA_snn_res.0.9",  resolution = 0.3, algorithm = 1)
Idents(seu) <- group.by
seu=FindSubCluster(seu, cluster='9',
                      graph.name="RNA_snn",
                      subcluster.name = "RNA_snn_res.0.9",  resolution = 0.6, algorithm = 1)

o(17,8)
ggarrange(
    DimPlot(seu, group.by=group.by, label=T,repel=T, label.size = 5, cols=manymanycolors),
    DimPlot(seu, group.by='integrated_ann',  label=T,repel=T, label.size = 5),
    nrow=1, ncol=2
)
Modularity Optimizer version 1.3.0 by Ludo Waltman and Nees Jan van Eck

Number of nodes: 59
Number of edges: 1324

Running Louvain algorithm...
Maximum modularity in 10 random starts: 0.4189
Number of communities: 2
Elapsed time: 0 seconds
Modularity Optimizer version 1.3.0 by Ludo Waltman and Nees Jan van Eck

Number of nodes: 506
Number of edges: 19986

Running Louvain algorithm...
Maximum modularity in 10 random starts: 0.8011
Number of communities: 2
Elapsed time: 0 seconds
Modularity Optimizer version 1.3.0 by Ludo Waltman and Nees Jan van Eck

Number of nodes: 306
Number of edges: 6459

Running Louvain algorithm...
Maximum modularity in 10 random starts: 0.7849
Number of communities: 3
Elapsed time: 0 seconds
Modularity Optimizer version 1.3.0 by Ludo Waltman and Nees Jan van Eck

Number of nodes: 188
Number of edges: 6357

Running Louvain algorithm...
Maximum modularity in 10 random starts: 0.6383
Number of communities: 2
Elapsed time: 0 seconds
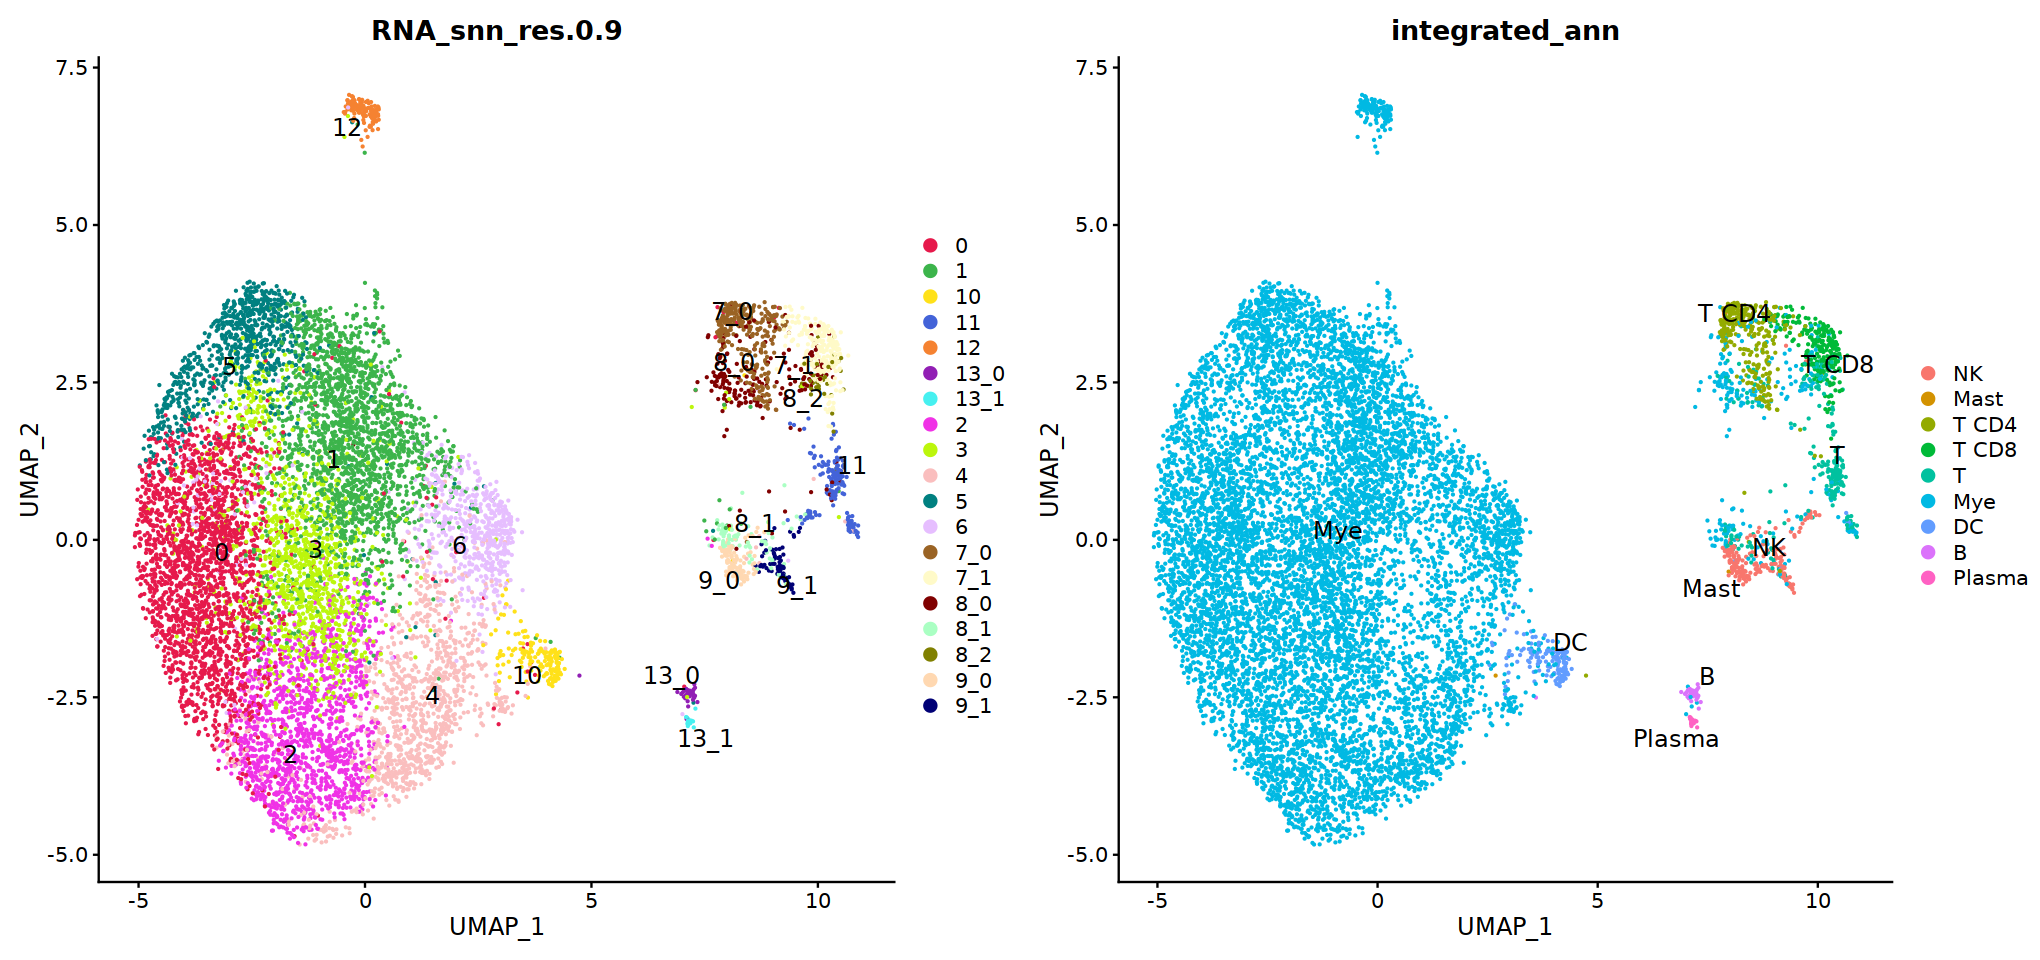
Idents(seu) <- group.by
deg = FindMarkers(seu,assay='RNA',slot='data',only.pos=T, ident.1='10')
deg
| p_val | avg_log2FC | pct.1 | pct.2 | p_val_adj | |
|---|---|---|---|---|---|
| <dbl> | <dbl> | <dbl> | <dbl> | <dbl> | |
| PPP1R14A | 0.000000e+00 | 1.3860938 | 0.228 | 0.002 | 0.000000e+00 |
| RAMP1 | 1.771237e-223 | 0.8806562 | 0.179 | 0.002 | 4.236090e-219 |
| CCR7 | 1.398171e-215 | 1.6916740 | 0.327 | 0.012 | 3.343866e-211 |
| CST7 | 2.355882e-203 | 2.8196222 | 0.802 | 0.092 | 5.634328e-199 |
| FLT3 | 1.009736e-193 | 0.7633965 | 0.179 | 0.003 | 2.414885e-189 |
| CALCRL | 1.160217e-140 | 0.7750171 | 0.154 | 0.004 | 2.774774e-136 |
| CLECL1 | 4.778446e-128 | 1.3585589 | 0.432 | 0.040 | 1.142813e-123 |
| CLEC9A | 6.639978e-123 | 0.8327681 | 0.117 | 0.002 | 1.588017e-118 |
| CD1C | 1.240497e-118 | 0.7074524 | 0.123 | 0.003 | 2.966772e-114 |
| SPIB | 8.564295e-113 | 0.4272058 | 0.111 | 0.002 | 2.048237e-108 |
| TSPAN13 | 1.800130e-107 | 0.7514904 | 0.142 | 0.004 | 4.305191e-103 |
| NR4A3 | 8.130870e-107 | 2.1879998 | 0.630 | 0.105 | 1.944579e-102 |
| PPA1 | 2.487502e-99 | 2.3265531 | 0.852 | 0.234 | 5.949110e-95 |
| NAPSA | 9.628646e-98 | 0.8183701 | 0.278 | 0.021 | 2.302787e-93 |
| PKIB | 1.211395e-93 | 0.9519411 | 0.167 | 0.007 | 2.897172e-89 |
| LAMP3 | 1.681934e-92 | 1.4973774 | 0.383 | 0.042 | 4.022513e-88 |
| SLC7A11 | 3.276422e-92 | 0.8410733 | 0.216 | 0.013 | 7.835890e-88 |
| CD74 | 5.829569e-81 | 1.8331087 | 1.000 | 0.979 | 1.394200e-76 |
| PLD4 | 8.757507e-81 | 0.6622097 | 0.204 | 0.013 | 2.094445e-76 |
| HLA-DPA1 | 9.610619e-77 | 2.1283895 | 0.994 | 0.838 | 2.298476e-72 |
| HLA-DQA1 | 5.000631e-74 | 2.3251615 | 0.981 | 0.578 | 1.195951e-69 |
| HLA-DQB1 | 3.415336e-71 | 2.1892917 | 0.963 | 0.631 | 8.168117e-67 |
| HLA-DPB1 | 2.748996e-69 | 2.1104986 | 0.981 | 0.734 | 6.574499e-65 |
| MCOLN2 | 1.115486e-68 | 0.9522998 | 0.302 | 0.035 | 2.667797e-64 |
| S100B | 7.161458e-68 | 1.7345059 | 0.228 | 0.020 | 1.712734e-63 |
| GPR183 | 1.318950e-65 | 1.8114348 | 0.698 | 0.197 | 3.154400e-61 |
| SERPINF1 | 2.122574e-65 | 0.7117911 | 0.191 | 0.015 | 5.076347e-61 |
| HLA-DRA | 1.079023e-64 | 1.4803308 | 1.000 | 0.925 | 2.580592e-60 |
| SPINT2 | 2.067103e-63 | 1.2716287 | 0.500 | 0.100 | 4.943684e-59 |
| HLA-DRB1 | 1.134360e-55 | 1.5500785 | 0.994 | 0.899 | 2.712936e-51 |
| ⋮ | ⋮ | ⋮ | ⋮ | ⋮ | ⋮ |
| EIF5A | 0.001461501 | 0.2523258 | 0.364 | 0.251 | 1 |
| NUDT21 | 0.002267145 | 0.2563024 | 0.210 | 0.127 | 1 |
| RIPK2 | 0.002271723 | 0.2570410 | 0.377 | 0.272 | 1 |
| CTSH | 0.002332276 | 0.3272370 | 0.525 | 0.389 | 1 |
| ARFGAP3 | 0.002442104 | 0.2900272 | 0.377 | 0.263 | 1 |
| TNFSF13B | 0.002779128 | 0.3828021 | 0.784 | 0.764 | 1 |
| TTC3 | 0.002901169 | 0.2812790 | 0.167 | 0.097 | 1 |
| GPBP1 | 0.002945997 | 0.2871555 | 0.438 | 0.317 | 1 |
| GTF2B | 0.003051315 | 0.2777346 | 0.389 | 0.277 | 1 |
| BATF3 | 0.003072604 | 0.2651612 | 0.160 | 0.093 | 1 |
| HIVEP1 | 0.003192695 | 0.2516475 | 0.179 | 0.107 | 1 |
| REV3L | 0.003849444 | 0.3578700 | 0.117 | 0.063 | 1 |
| RASGRP3 | 0.004060856 | 0.2659165 | 0.173 | 0.103 | 1 |
| ATRX | 0.004235529 | 0.2930651 | 0.296 | 0.204 | 1 |
| SRSF10 | 0.004367401 | 0.2596944 | 0.346 | 0.245 | 1 |
| MOB1A | 0.004394463 | 0.2841430 | 0.704 | 0.590 | 1 |
| MTRNR2L12 | 0.004558415 | 0.4499088 | 0.586 | 0.477 | 1 |
| RAB31 | 0.005187774 | 0.2504069 | 0.636 | 0.534 | 1 |
| SEC14L1 | 0.006146312 | 0.3074761 | 0.321 | 0.234 | 1 |
| ARID1B | 0.007456075 | 0.2532507 | 0.191 | 0.121 | 1 |
| IL7R | 0.008069367 | 0.4370704 | 0.278 | 0.197 | 1 |
| SMC6 | 0.009504877 | 0.3718505 | 0.130 | 0.076 | 1 |
| A2M | 0.013831455 | 0.4176159 | 0.154 | 0.097 | 1 |
| ENPP2 | 0.014184498 | 0.2571853 | 0.179 | 0.117 | 1 |
| CPVL | 0.015772036 | 0.4006698 | 0.296 | 0.219 | 1 |
| ROCK1 | 0.016525952 | 0.3005788 | 0.370 | 0.285 | 1 |
| MPC2 | 0.019465111 | 0.2671267 | 0.154 | 0.101 | 1 |
| CCL4L2 | 0.037320384 | 0.4097075 | 0.444 | 0.539 | 1 |
| CXCL10 | 0.125503161 | 0.2764656 | 0.796 | 0.750 | 1 |
| MRPS6 | 0.544391103 | 0.2535396 | 0.235 | 0.214 | 1 |
Idents(seu) <- group.by
deg = FindMarkers(seu,assay='RNA',slot='data',only.pos=T, ident.1='13_0')
deg
| p_val | avg_log2FC | pct.1 | pct.2 | p_val_adj | |
|---|---|---|---|---|---|
| <dbl> | <dbl> | <dbl> | <dbl> | <dbl> | |
| AFF3 | 0.000000e+00 | 1.2115857 | 0.220 | 0.000 | 0.000000e+00 |
| MS4A1 | 0.000000e+00 | 3.7431153 | 0.756 | 0.003 | 0.000000e+00 |
| LINC02397 | 0.000000e+00 | 1.0632617 | 0.244 | 0.000 | 0.000000e+00 |
| IGHG2 | 0.000000e+00 | 1.2881285 | 0.220 | 0.000 | 0.000000e+00 |
| CD19 | 0.000000e+00 | 1.8510701 | 0.341 | 0.002 | 0.000000e+00 |
| TNFRSF13B | 0.000000e+00 | 1.3257518 | 0.293 | 0.001 | 0.000000e+00 |
| CD79A | 0.000000e+00 | 3.3111857 | 0.756 | 0.002 | 0.000000e+00 |
| VPREB3 | 0.000000e+00 | 1.4666157 | 0.244 | 0.000 | 0.000000e+00 |
| TCL1A | 5.278945e-300 | 0.8402617 | 0.146 | 0.000 | 1.262512e-295 |
| FCRL5 | 7.120031e-242 | 1.4100743 | 0.244 | 0.001 | 1.702827e-237 |
| AICDA | 7.452311e-238 | 0.7960120 | 0.171 | 0.000 | 1.782295e-233 |
| IGHA2 | 2.369602e-204 | 3.0685051 | 0.220 | 0.001 | 5.667140e-200 |
| IGKC | 7.818693e-196 | 2.1552564 | 0.463 | 0.008 | 1.869919e-191 |
| AC104699.1 | 3.749182e-190 | 0.7162195 | 0.171 | 0.001 | 8.966545e-186 |
| BANK1 | 1.025332e-184 | 1.7605203 | 0.390 | 0.006 | 2.452185e-180 |
| FAM177B | 1.250574e-182 | 0.8232954 | 0.122 | 0.000 | 2.990872e-178 |
| IGKV3-11 | 1.975303e-182 | 2.6990614 | 0.122 | 0.000 | 4.724136e-178 |
| FCRLA | 4.677210e-138 | 1.0931731 | 0.220 | 0.002 | 1.118601e-133 |
| FAM30A | 1.054888e-121 | 0.5721402 | 0.122 | 0.001 | 2.522869e-117 |
| SPIB | 3.390754e-114 | 1.2402058 | 0.220 | 0.003 | 8.109328e-110 |
| COBLL1 | 1.833266e-109 | 0.8423447 | 0.171 | 0.002 | 4.384438e-105 |
| IGHM | 4.471128e-108 | 1.6418120 | 0.366 | 0.010 | 1.069315e-103 |
| PAX5 | 1.674020e-99 | 1.7032122 | 0.366 | 0.010 | 4.003587e-95 |
| TLR10 | 2.765995e-97 | 1.0955262 | 0.220 | 0.004 | 6.615154e-93 |
| BCAS4 | 2.177607e-96 | 1.2795384 | 0.268 | 0.006 | 5.207965e-92 |
| PKIG | 2.248644e-92 | 0.8484417 | 0.195 | 0.003 | 5.377856e-88 |
| POU2AF1 | 2.549768e-92 | 0.8942448 | 0.195 | 0.003 | 6.098025e-88 |
| PAWR | 2.390783e-91 | 0.8393489 | 0.122 | 0.001 | 5.717798e-87 |
| CPNE5 | 9.771284e-89 | 0.7976815 | 0.171 | 0.002 | 2.336900e-84 |
| IGHA1 | 3.226581e-87 | 5.0659507 | 0.390 | 0.014 | 7.716690e-83 |
| ⋮ | ⋮ | ⋮ | ⋮ | ⋮ | ⋮ |
| WBP11 | 0.8784885 | 0.3023214 | 0.146 | 0.148 | 1 |
| SRP54 | 0.8824998 | 0.2543175 | 0.195 | 0.200 | 1 |
| MRPS34 | 0.8842776 | 0.2921382 | 0.122 | 0.124 | 1 |
| MDH2 | 0.8863775 | 0.2527231 | 0.195 | 0.215 | 1 |
| LMAN1 | 0.8870431 | 0.2913915 | 0.146 | 0.156 | 1 |
| MRPL54 | 0.8886707 | 0.2729018 | 0.244 | 0.259 | 1 |
| SYNRG | 0.8892795 | 0.2822726 | 0.122 | 0.122 | 1 |
| CYCS | 0.8924229 | 0.3100914 | 0.317 | 0.352 | 1 |
| PRKAR1A | 0.8925752 | 0.2895273 | 0.268 | 0.291 | 1 |
| ITPA | 0.9000458 | 0.2839973 | 0.098 | 0.108 | 1 |
| PTBP3 | 0.9053289 | 0.2847844 | 0.244 | 0.259 | 1 |
| CDC40 | 0.9084888 | 0.3301433 | 0.122 | 0.127 | 1 |
| SLC38A10 | 0.9098117 | 0.2533207 | 0.122 | 0.121 | 1 |
| SP140L | 0.9300022 | 0.3073402 | 0.146 | 0.152 | 1 |
| KLF2 | 0.9363792 | 0.5139782 | 0.341 | 0.413 | 1 |
| IMPA1 | 0.9399341 | 0.2777391 | 0.098 | 0.101 | 1 |
| C22orf39 | 0.9434074 | 0.4617012 | 0.122 | 0.126 | 1 |
| MFSD10 | 0.9446536 | 0.3430783 | 0.122 | 0.131 | 1 |
| RAD21 | 0.9467165 | 0.3600632 | 0.220 | 0.235 | 1 |
| IK | 0.9517785 | 0.2836080 | 0.195 | 0.223 | 1 |
| PHB | 0.9545396 | 0.2620956 | 0.171 | 0.177 | 1 |
| YIPF4 | 0.9617287 | 0.2657372 | 0.122 | 0.130 | 1 |
| HEBP2 | 0.9638975 | 0.2522116 | 0.122 | 0.129 | 1 |
| BIN2 | 0.9682338 | 0.3960081 | 0.122 | 0.125 | 1 |
| NIPBL | 0.9802839 | 0.3612951 | 0.171 | 0.187 | 1 |
| HIST1H1E | 0.9853331 | 0.2864033 | 0.122 | 0.131 | 1 |
| UTRN | 0.9873607 | 0.3182080 | 0.195 | 0.214 | 1 |
| STMP1 | 0.9901139 | 0.3010591 | 0.293 | 0.336 | 1 |
| ZSWIM7 | 0.9970898 | 0.3183100 | 0.098 | 0.106 | 1 |
| BBX | 0.9996246 | 0.3938759 | 0.146 | 0.155 | 1 |
Idents(seu) <- group.by
deg = FindMarkers(seu,assay='RNA',slot='data',only.pos=T, ident.1='13_1')
deg
| p_val | avg_log2FC | pct.1 | pct.2 | p_val_adj | |
|---|---|---|---|---|---|
| <dbl> | <dbl> | <dbl> | <dbl> | <dbl> | |
| FCRL5 | 0.000000e+00 | 1.1881936 | 0.444 | 0.001 | 0.000000e+00 |
| IGKC | 0.000000e+00 | 7.8231229 | 0.889 | 0.008 | 0.000000e+00 |
| JCHAIN | 0.000000e+00 | 6.7405427 | 0.944 | 0.006 | 0.000000e+00 |
| PKHD1L1 | 0.000000e+00 | 0.6866912 | 0.222 | 0.000 | 0.000000e+00 |
| POU2AF1 | 0.000000e+00 | 2.0326100 | 0.556 | 0.003 | 0.000000e+00 |
| IGHA2 | 0.000000e+00 | 5.0835864 | 0.556 | 0.001 | 0.000000e+00 |
| AC012236.1 | 0.000000e+00 | 1.5907190 | 0.389 | 0.000 | 0.000000e+00 |
| TNFRSF17 | 0.000000e+00 | 1.5510359 | 0.500 | 0.000 | 0.000000e+00 |
| IGLL5 | 0.000000e+00 | 3.9190540 | 0.556 | 0.001 | 0.000000e+00 |
| LINC01926 | 1.043143e-266 | 0.3280761 | 0.111 | 0.000 | 2.494780e-262 |
| BVES-AS1 | 1.043143e-266 | 0.7458155 | 0.111 | 0.000 | 2.494780e-262 |
| AC007569.1 | 5.378706e-266 | 0.8865256 | 0.222 | 0.000 | 1.286371e-261 |
| FCRL2 | 1.750770e-255 | 0.9302752 | 0.278 | 0.001 | 4.187142e-251 |
| MZB1 | 1.029777e-251 | 3.2171950 | 0.667 | 0.006 | 2.462815e-247 |
| IGHV4-34 | 5.123408e-239 | 7.5225024 | 0.500 | 0.003 | 1.225314e-234 |
| DERL3 | 9.545504e-218 | 2.0371276 | 0.444 | 0.003 | 2.282903e-213 |
| JSRP1 | 1.280165e-207 | 1.0810251 | 0.278 | 0.001 | 3.061643e-203 |
| IGHA1 | 1.563382e-205 | 7.8572194 | 0.889 | 0.014 | 3.738983e-201 |
| CPNE5 | 1.058052e-202 | 1.1777827 | 0.389 | 0.002 | 2.530437e-198 |
| IGKV3D-11 | 2.892416e-178 | 1.7993092 | 0.111 | 0.000 | 6.917502e-174 |
| IGKV1D-39 | 3.354562e-178 | 0.3181003 | 0.111 | 0.000 | 8.022770e-174 |
| MEF2B | 6.923225e-164 | 0.5175482 | 0.222 | 0.001 | 1.655758e-159 |
| TNFRSF13B | 4.568852e-158 | 0.9314197 | 0.278 | 0.001 | 1.092687e-153 |
| IGKV3-11 | 2.427840e-150 | 6.7820865 | 0.167 | 0.000 | 5.806423e-146 |
| AC104699.1 | 4.629948e-142 | 0.7265243 | 0.222 | 0.001 | 1.107298e-137 |
| IGKV3D-20 | 5.311957e-134 | 1.8756509 | 0.111 | 0.000 | 1.270408e-129 |
| GLDC | 5.615501e-134 | 0.3842739 | 0.111 | 0.000 | 1.343003e-129 |
| IGHV3-23 | 5.615501e-134 | 1.5025722 | 0.111 | 0.000 | 1.343003e-129 |
| CCR10 | 4.538863e-133 | 1.1549153 | 0.278 | 0.002 | 1.085515e-128 |
| CD79A | 1.122913e-119 | 1.4919731 | 0.389 | 0.004 | 2.685558e-115 |
| ⋮ | ⋮ | ⋮ | ⋮ | ⋮ | ⋮ |
| LARP4 | 0.5283949 | 0.2509729 | 0.167 | 0.123 | 1 |
| PSME3 | 0.5313583 | 0.2671017 | 0.167 | 0.123 | 1 |
| SELENOF | 0.5326378 | 0.2561585 | 0.389 | 0.350 | 1 |
| GLRX2 | 0.5363204 | 0.2608622 | 0.222 | 0.159 | 1 |
| HMGN2 | 0.5477280 | 0.3800125 | 0.611 | 0.604 | 1 |
| ZNF22 | 0.5780030 | 0.4673363 | 0.111 | 0.078 | 1 |
| COX14 | 0.5789804 | 0.3193504 | 0.278 | 0.231 | 1 |
| CARD6 | 0.5924871 | 0.2646882 | 0.111 | 0.080 | 1 |
| CRYBG1 | 0.6160351 | 0.2579912 | 0.222 | 0.170 | 1 |
| UBE2W | 0.6249913 | 0.3563800 | 0.111 | 0.085 | 1 |
| IST1 | 0.6329368 | 0.3059114 | 0.222 | 0.194 | 1 |
| LUC7L2 | 0.6339438 | 0.3071857 | 0.111 | 0.085 | 1 |
| MTRNR2L8 | 0.6346978 | 0.4450103 | 0.111 | 0.087 | 1 |
| SETX | 0.6361529 | 0.3335027 | 0.278 | 0.243 | 1 |
| EEF1B2 | 0.6494688 | 0.5473060 | 0.500 | 0.534 | 1 |
| PPP1R15A | 0.6497200 | 0.3196423 | 0.556 | 0.520 | 1 |
| TRIM33 | 0.6604463 | 0.4288745 | 0.222 | 0.186 | 1 |
| MALAT1 | 0.6929981 | 0.4336576 | 1.000 | 0.999 | 1 |
| PSMD2 | 0.7874723 | 0.2532833 | 0.167 | 0.151 | 1 |
| CHCHD1 | 0.7948785 | 0.3006426 | 0.167 | 0.157 | 1 |
| PSMC6 | 0.8120358 | 0.4412437 | 0.222 | 0.216 | 1 |
| CCT2 | 0.8327520 | 0.2768812 | 0.167 | 0.193 | 1 |
| GAPDH | 0.8419210 | 0.2582246 | 0.889 | 0.932 | 1 |
| GLO1 | 0.8510826 | 0.3945917 | 0.111 | 0.135 | 1 |
| MOSPD2 | 0.8861715 | 0.4606223 | 0.111 | 0.106 | 1 |
| LUCAT1 | 0.8945124 | 0.2600994 | 0.111 | 0.109 | 1 |
| RNF138 | 0.8959636 | 0.2635342 | 0.111 | 0.133 | 1 |
| UTP6 | 0.8984291 | 0.3170611 | 0.111 | 0.111 | 1 |
| SELPLG | 0.9047858 | 0.4807303 | 0.222 | 0.241 | 1 |
| ECPAS | 0.9810346 | 0.2717288 | 0.111 | 0.124 | 1 |
cell.sel = Cells(subset(seu, RNA_snn_res.0.9=='13_0'))
seu@meta.data[cell.sel, "persample_ann"] = 'B'

cell.sel = Cells(subset(seu, RNA_snn_res.0.9=='13_1'))
seu@meta.data[cell.sel, "persample_ann"] = 'Plasma'
DC
# pDC
p=Nebulosa::plot_density(seu,c('IRF4','LILRA4','LILRB4','IRF8'),joint=T)&theme(
    axis.title=element_blank(),axis.ticks=element_blank(),axis.text = element_blank())&NoLegend()
o(5*6, 5*1)
p+plot_layout(ncol = 6)

# cDC1
p=Nebulosa::plot_density(seu,c('HLA-DQA1','BATF3','CADM1','CLEC9A','XCR1'),joint=T)&theme(
    axis.title=element_blank(),axis.ticks=element_blank(),axis.text = element_blank())&NoLegend()
o(5*6, 5*1)
p+plot_layout(ncol = 6)


# cDC2
p=Nebulosa::plot_density(seu,c('CD14','PLD4','CD1C','CX3CR1','CLEC10A'),joint=T)&theme(
    axis.title=element_blank(),axis.ticks=element_blank(),axis.text = element_blank())&NoLegend()
o(5*6, 5*1)
p+plot_layout(ncol = 6)


cell.sel = Cells(subset(seu, RNA_snn_res.0.9=='10'))
seu@meta.data[cell.sel, "persample_ann"] = 'cDC1'
T
# T cell markers
o(5*5, 5*7)
FeaturePlot(seu, ncol = 5,pt.size=0.01,
features = c("CD3D","CD3E",'TRAC','TRBC1','TRGC2',
             'TRGC1','TRDC',"CD4",'CD8A','CD8B',
             'RORC','FOXP3','CD28','IL2RA',"CD44",
             'CD69','CD27','PRF1','GZMK','ID2',
             'RORC','GATA3','ZBTB16','IL7R','TBX21',
             'NKG7','GNLY','EOMES','KLRB1','TOX',
             "TOX2",'CXCR5','SELL','CD68','MT2A',
             'CST7','HOPX','GZMM','KLRD1','KLRC2',
             'KLRF1'), order=F)&theme(axis.line = element_blank(),
axis.title = element_blank(),axis.text = element_blank(), axis.ticks=element_blank()
)
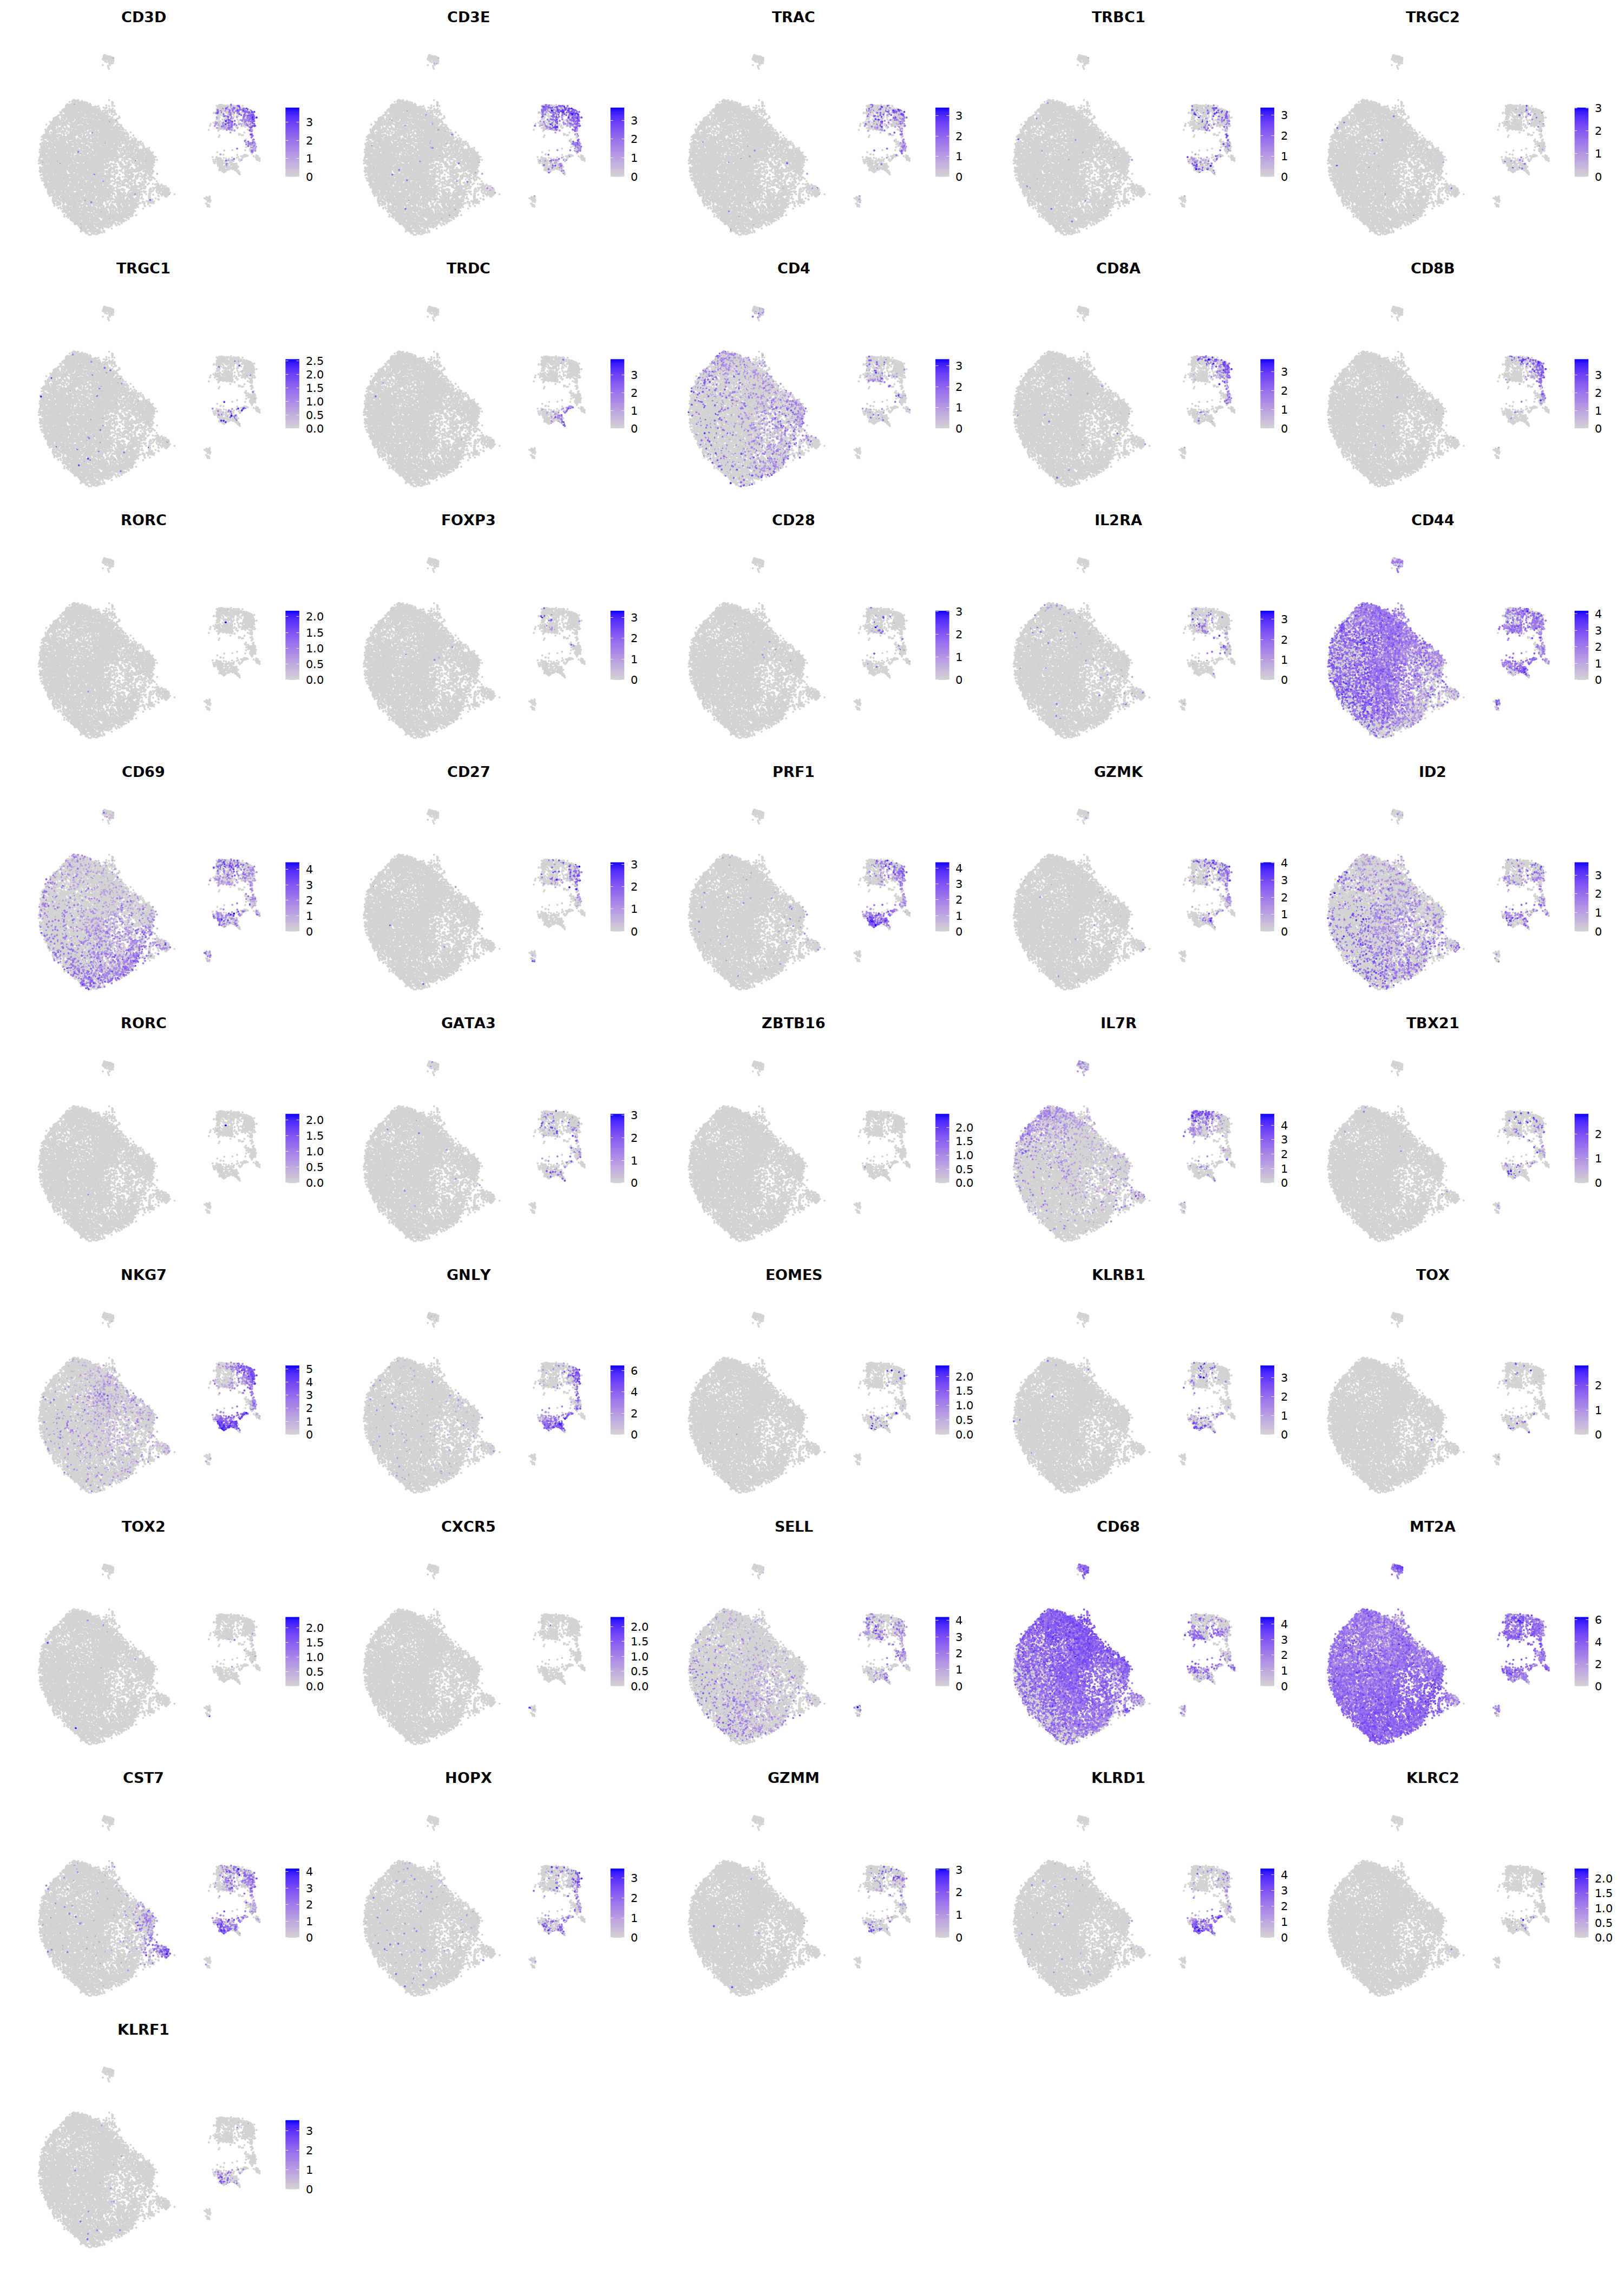
# Treg
p=Nebulosa::plot_density(seu,c('CD3E','CD4','FOXP3'),joint=T)&theme(
    axis.title=element_blank(),axis.ticks=element_blank(),axis.text = element_blank())&NoLegend()

o(5*6, 5*1)
p+plot_layout(ncol = 6)

cell.sel = Cells(subset(seu, RNA_snn_res.0.9=='7_0'))
seu@meta.data[cell.sel, "persample_ann"] = 'T CD4'

cell.sel = Cells(subset(seu, RNA_snn_res.0.9=='8_0'))
seu@meta.data[cell.sel, "persample_ann"] = 'T CD4'
cell.sel = Cells(subset(seu, RNA_snn_res.0.9=='7_1'))
seu@meta.data[cell.sel, "persample_ann"] = 'T CD8'

cell.sel = Cells(subset(seu, RNA_snn_res.0.9=='8_2'))
seu@meta.data[cell.sel, "persample_ann"] = 'T CD8'

cell.sel = Cells(subset(seu, RNA_snn_res.0.9=='11'))
seu@meta.data[cell.sel, "persample_ann"] = 'T CD8'
cell.sel = Cells(subset(seu, RNA_snn_res.0.9=='8_1'))
seu@meta.data[cell.sel, "persample_ann"] = 'gdT'

cell.sel = Cells(subset(seu, RNA_snn_res.0.9=='9_0'))
seu@meta.data[cell.sel, "persample_ann"] = 'gdT'

cell.sel = Cells(subset(seu, RNA_snn_res.0.9=='9_1'))
seu@meta.data[cell.sel, "persample_ann"] = 'gdT'
Mac
# macrophages
o(5*5, 5*9)
FeaturePlot(seu, ncol = 5, pt.size=0.01,
            features = c("CD14",'LYZ',"FCGR3A",
'OLR1','CDKN1C','LILRB2',"ITGAL",
'CDKN1C','LILRB2','ITGAL',
'S100A12','PROK2','S100A8','VCAN',
'NT5E','ANGPTL4','CXCL5','BAG3',
'DNASE2',
'MMP7','TIMP3','CHI3L1','FABP5',
'CHIT1','GDF15','CTSK',
'CCL18','PLTP','CD209','F13A1',
'FABP4','RBP4','PPARG','MARCO',
'CXCL12','IGSF21','C3',
'CXCL9','CXCL10','CXCL11','GBP1',
'CCL17',"CLEC10A",
"TOP2A","MKI67",'CDK1')
)&theme(
legend.position=c(0.8,0.8),
axis.line = element_blank(),
axis.title = element_blank(),axis.text = element_blank(), axis.ticks=element_blank()
)
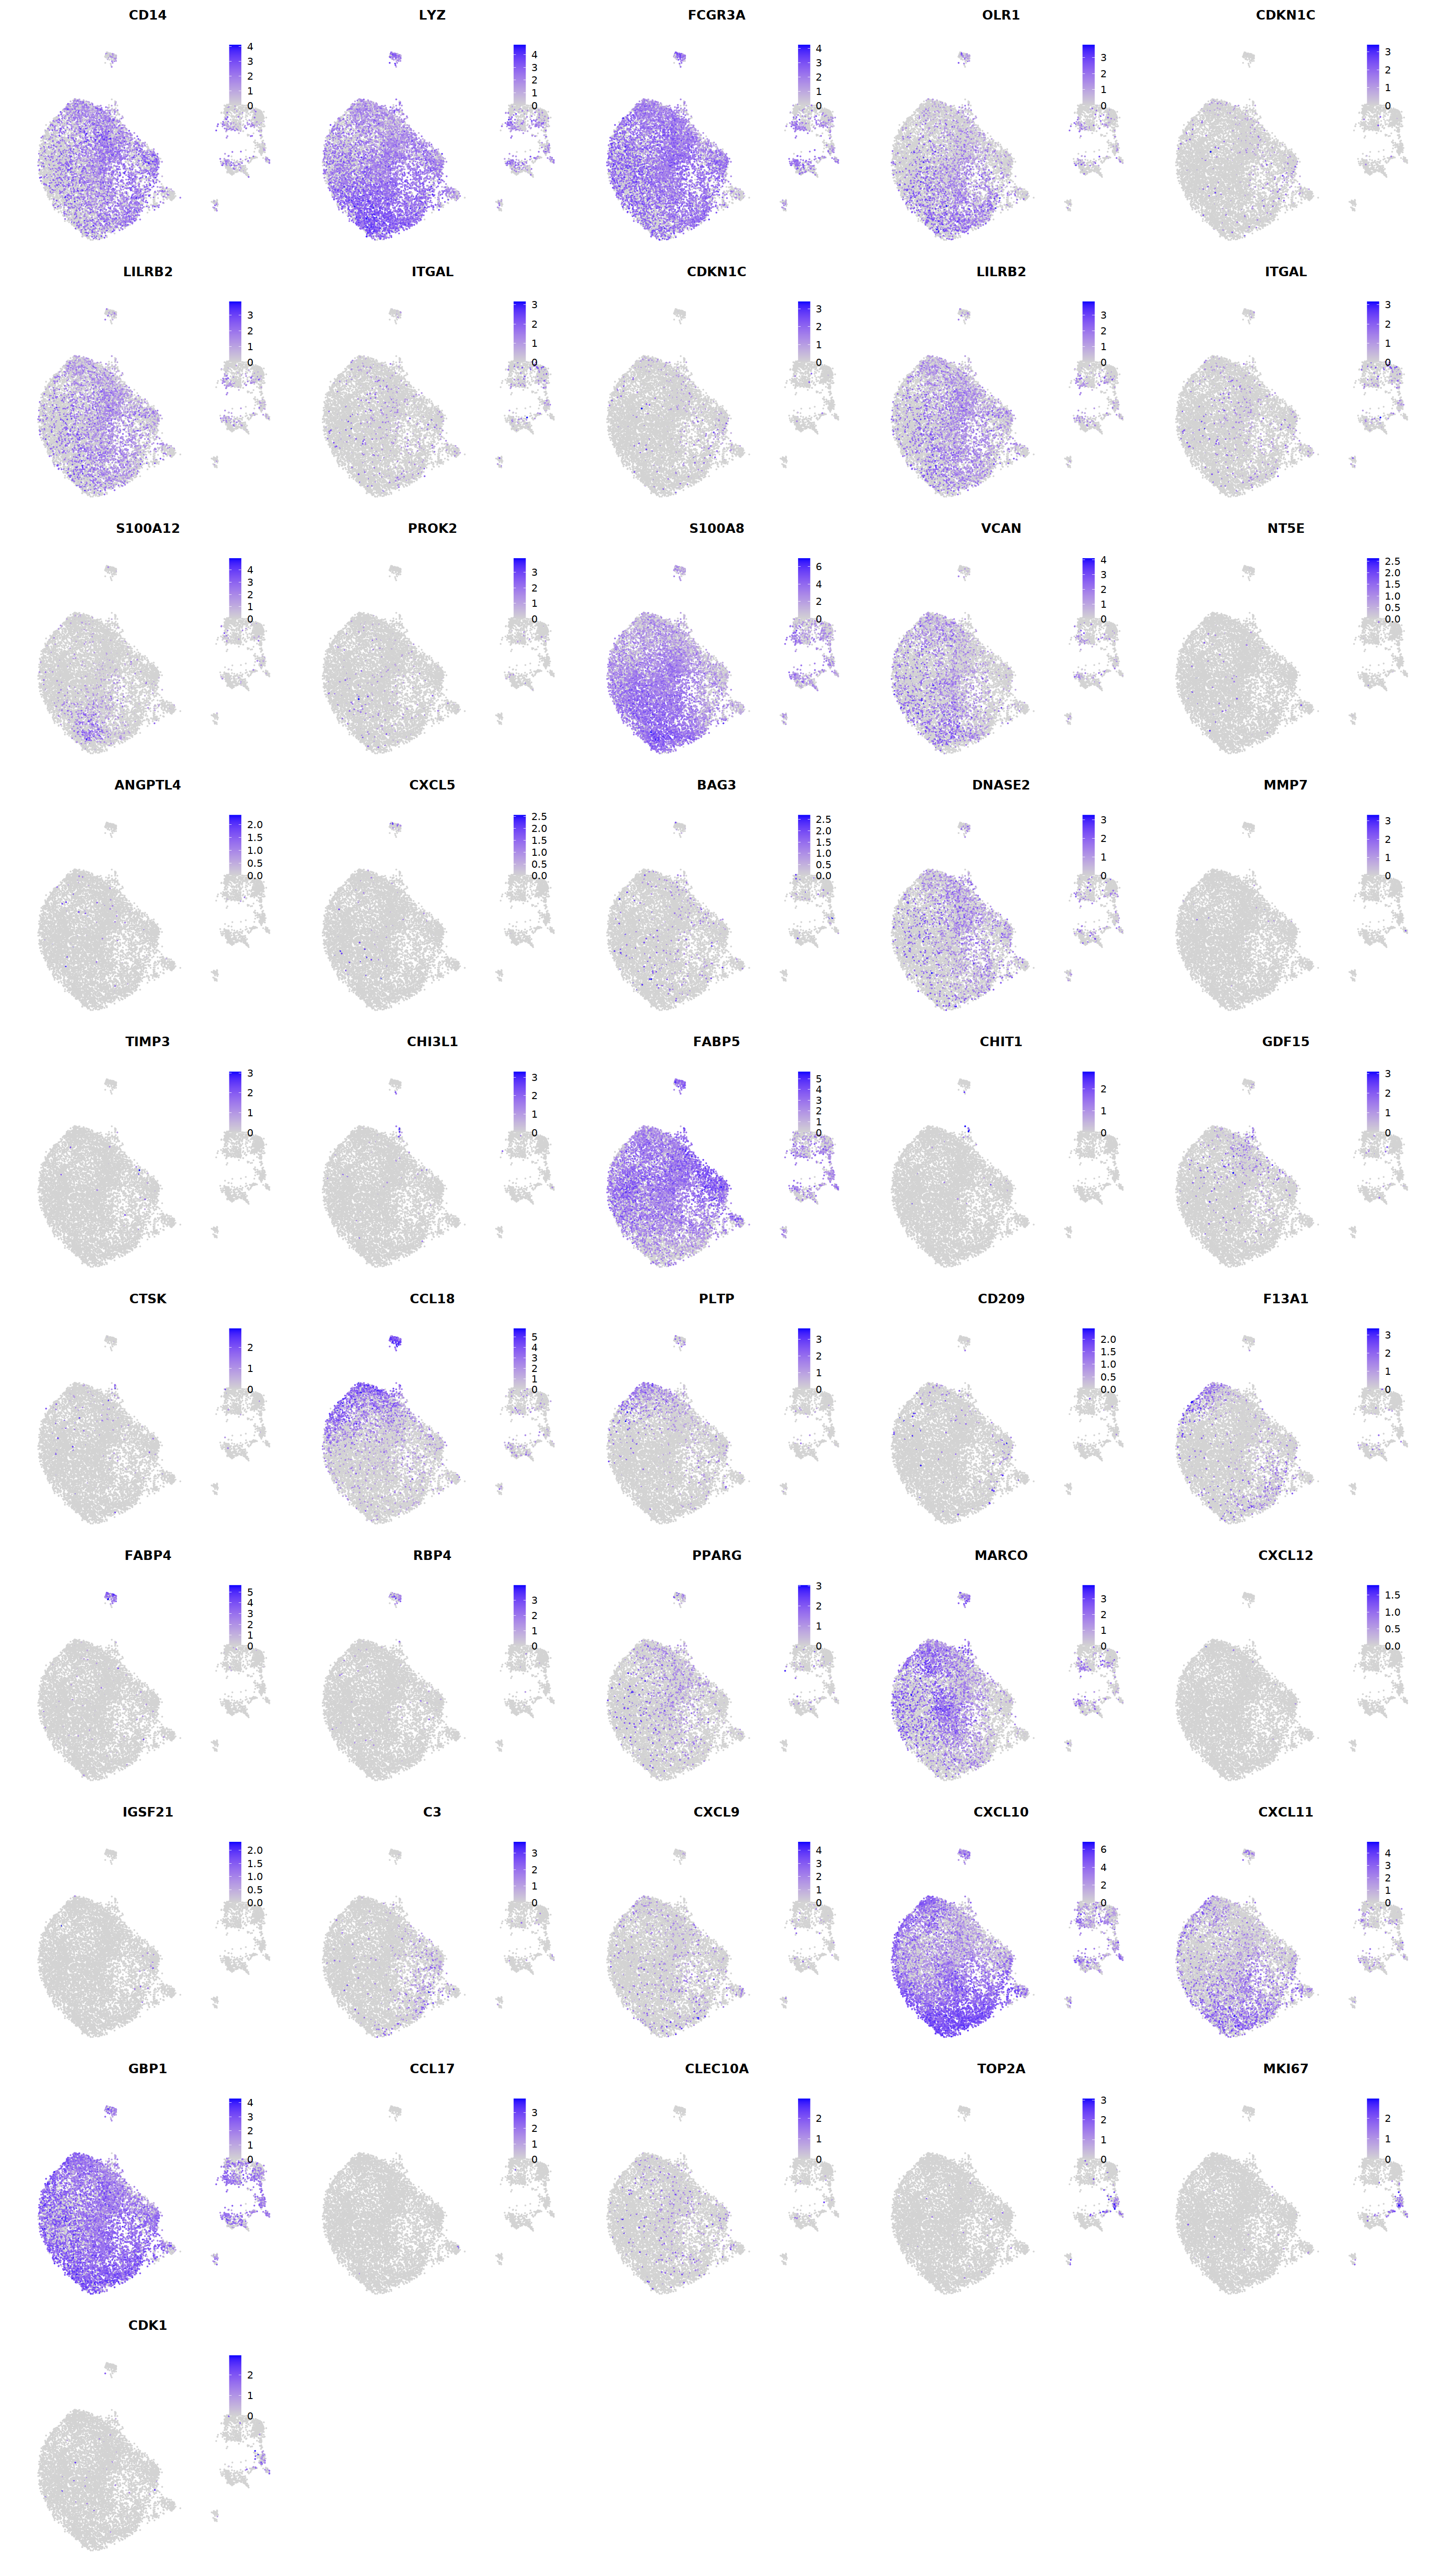
cell.sel = Cells(subset(seu, RNA_snn_res.0.9=='0'))
seu@meta.data[cell.sel, "persample_ann"] = 'macrophage'

cell.sel = Cells(subset(seu, RNA_snn_res.0.9=='1'))
seu@meta.data[cell.sel, "persample_ann"] = 'macrophage'

cell.sel = Cells(subset(seu, RNA_snn_res.0.9=='2'))
seu@meta.data[cell.sel, "persample_ann"] = 'macrophage'

cell.sel = Cells(subset(seu, RNA_snn_res.0.9=='3'))
seu@meta.data[cell.sel, "persample_ann"] = 'macrophage'

cell.sel = Cells(subset(seu, RNA_snn_res.0.9=='4'))
seu@meta.data[cell.sel, "persample_ann"] = 'macrophage'

cell.sel = Cells(subset(seu, RNA_snn_res.0.9=='5'))
seu@meta.data[cell.sel, "persample_ann"] = 'macrophage'

cell.sel = Cells(subset(seu, RNA_snn_res.0.9=='6'))
seu@meta.data[cell.sel, "persample_ann"] = 'macrophage'

cell.sel = Cells(subset(seu, RNA_snn_res.0.9=='12'))
seu@meta.data[cell.sel, "persample_ann"] = 'macrophage'
o(8,7);DimPlot(seu, group.by='persample_ann', label=T, repel=T, pt.size=0.1)
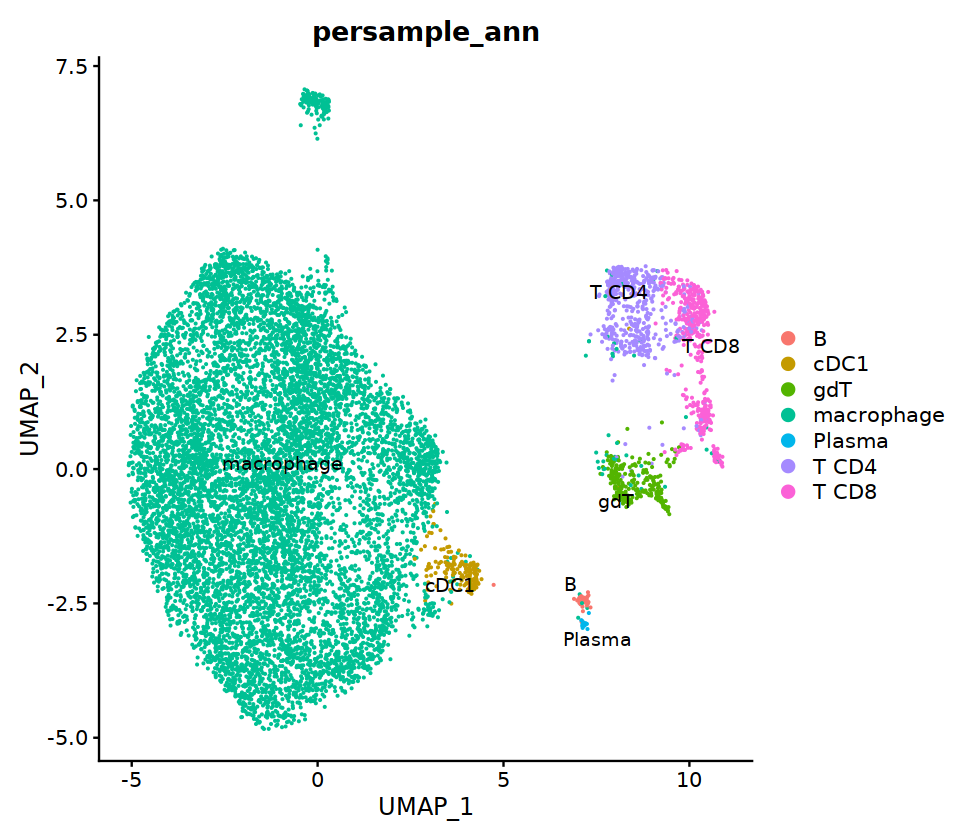
seu -> immune.list[[sample_name]]
S2
# context switching
sample_name='S2'

seu= immune.list[[sample_name]]
group.by= 'RNA_snn_res.0.9'

Idents(seu)<-group.by
seu=FindSubCluster(seu, cluster='16',
                      graph.name="RNA_snn",
                      subcluster.name = "RNA_snn_res.0.9",  resolution = 0.6, algorithm = 1)

Idents(seu)<-group.by
seu=FindSubCluster(seu, cluster='10',
                      graph.name="RNA_snn",
                      subcluster.name = "RNA_snn_res.0.9",  resolution = 0.2, algorithm = 1)


o(17,8)
ggarrange(
    DimPlot(seu, group.by=group.by, label=T,repel=T, label.size = 5, cols=manymanycolors),
    DimPlot(seu, group.by='integrated_ann',  label=T,repel=T, label.size = 5),
    nrow=1, ncol=2
)
Modularity Optimizer version 1.3.0 by Ludo Waltman and Nees Jan van Eck

Number of nodes: 88
Number of edges: 1758

Running Louvain algorithm...
Maximum modularity in 10 random starts: 0.6406
Number of communities: 2
Elapsed time: 0 seconds
Modularity Optimizer version 1.3.0 by Ludo Waltman and Nees Jan van Eck

Number of nodes: 249
Number of edges: 7040

Running Louvain algorithm...
Maximum modularity in 10 random starts: 0.8000
Number of communities: 1
Elapsed time: 0 seconds
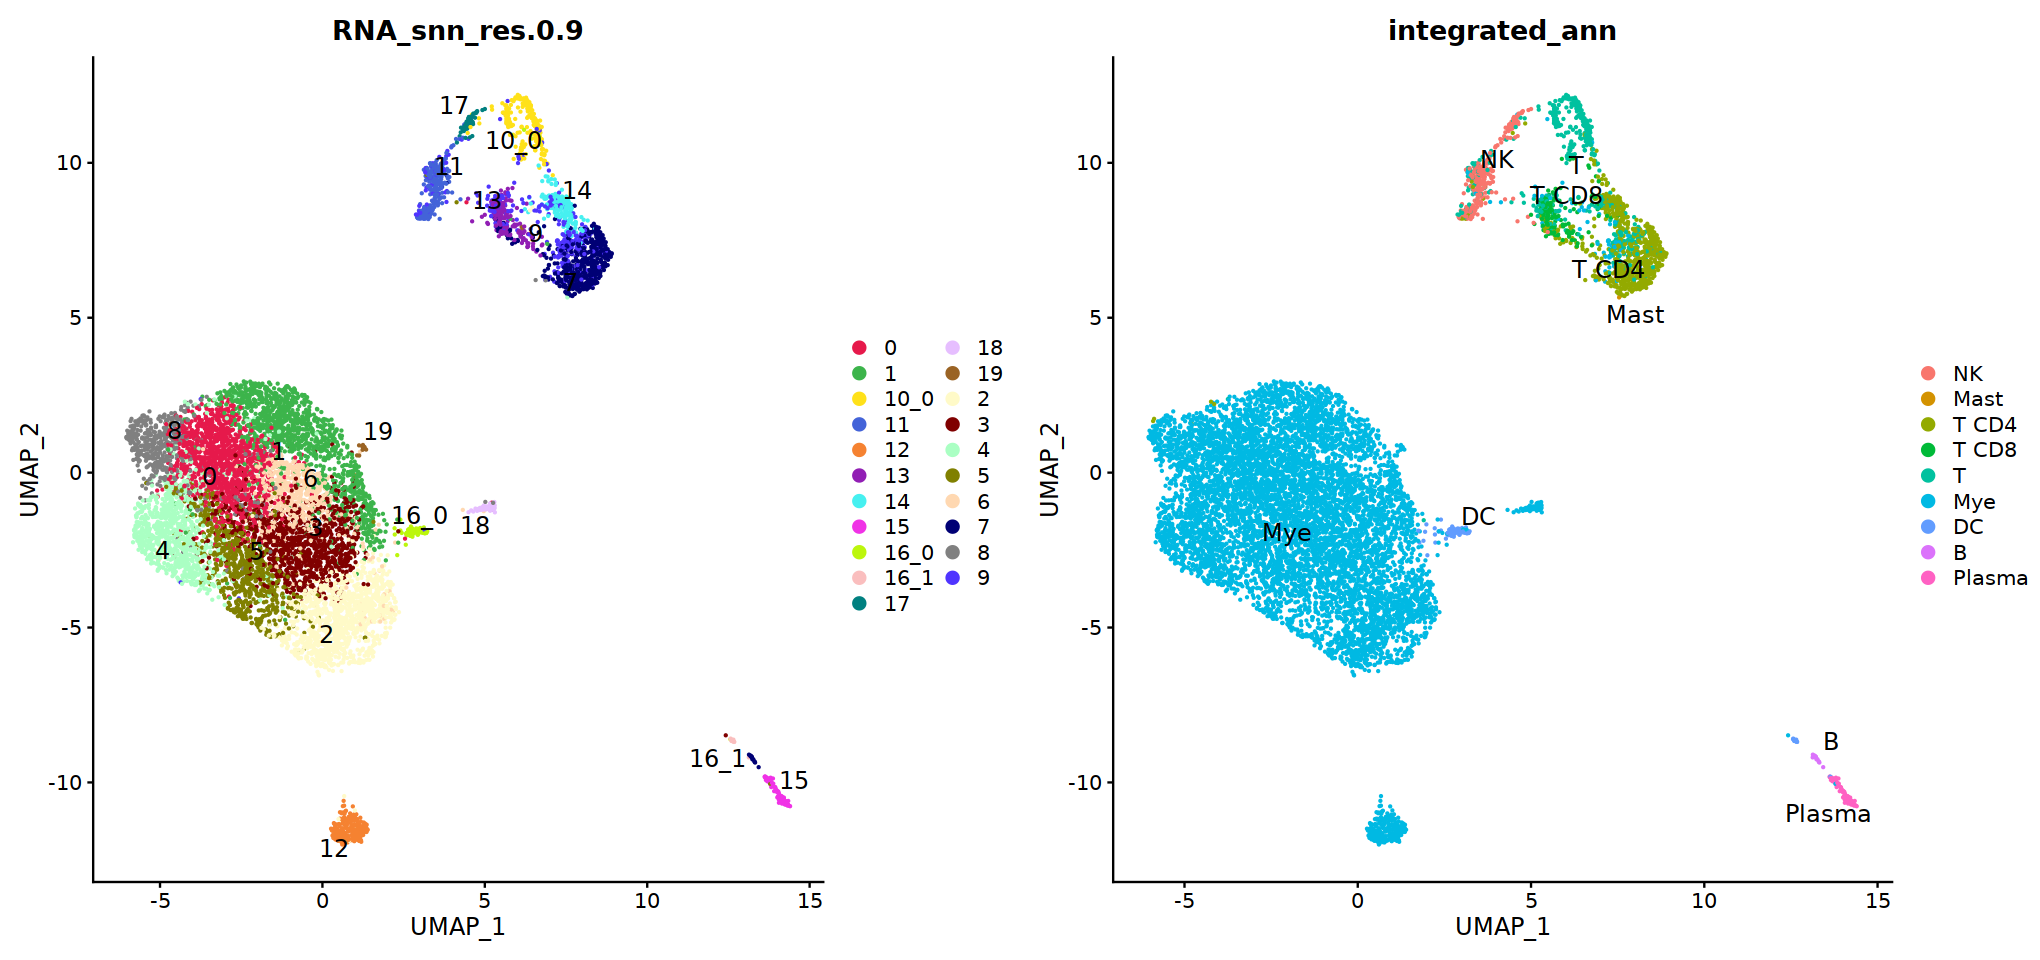
# adopt integrated_ann first
seu@meta.data[, "persample_ann"] = as.character(seu@meta.data[, "integrated_ann"] )
o(5*5, 5*3)
FeaturePlot(seu, ncol=5,
features = c('CD3E','CD68','NKG7','CD4','CD8A',
             'TRAC','MS4A1','MS4A2','IGHG4','CD1C',
             'LILRA4','LAMP3','CD68','ITGAM','ITGAX')
)&theme(legend.position=c(0.8,0.8))&theme(axis.line = element_blank(),
axis.title = element_blank(),axis.text = element_blank(), axis.ticks=element_blank()
)
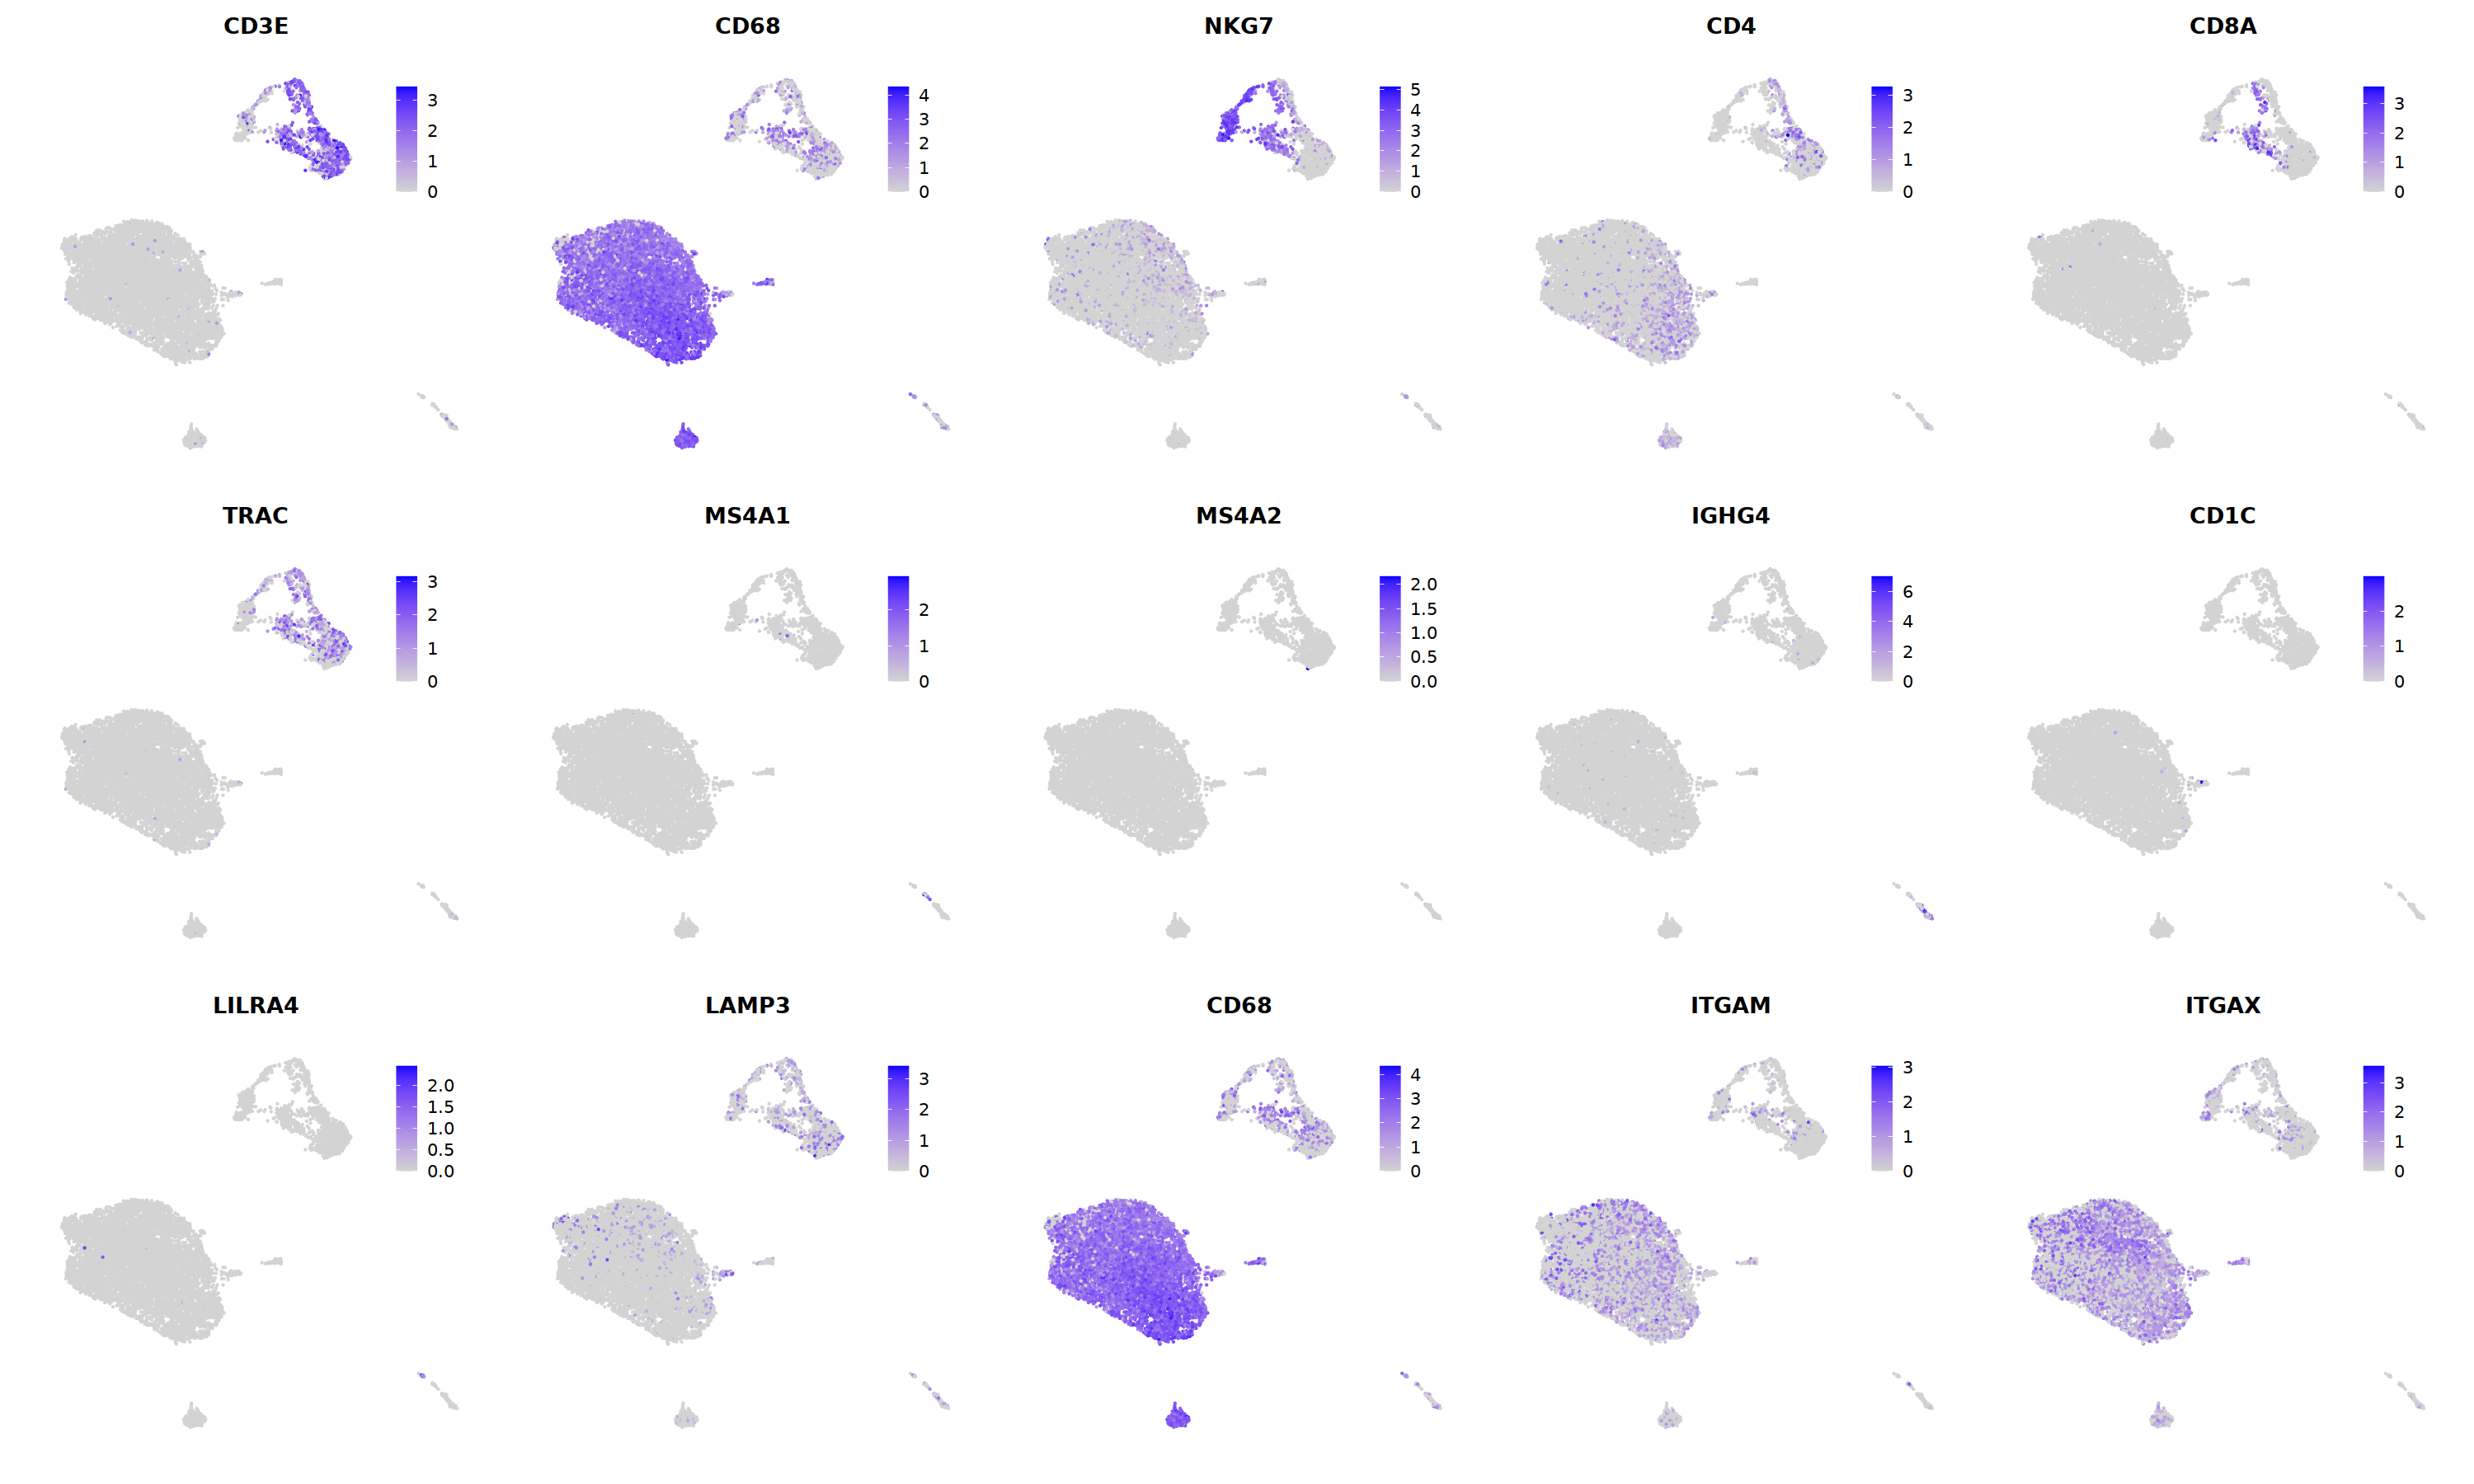
DC
# pDC
p=Nebulosa::plot_density(seu,c('IRF4','LILRA4','LILRB4','IRF8'),joint=T)&theme(
    axis.title=element_blank(),axis.ticks=element_blank(),axis.text = element_blank())&NoLegend()
o(5*6, 5*1)
p+plot_layout(ncol = 6)

# cDC1
p=Nebulosa::plot_density(seu,c('HLA-DQA1','BATF3','CADM1','CLEC9A','XCR1'),joint=T)&theme(
    axis.title=element_blank(),axis.ticks=element_blank(),axis.text = element_blank())&NoLegend()
o(5*6, 5*1)
p+plot_layout(ncol = 6)


# cDC2
p=Nebulosa::plot_density(seu,c('CD14','PLD4','CD1C','CX3CR1','CLEC10A'),joint=T)&theme(
    axis.title=element_blank(),axis.ticks=element_blank(),axis.text = element_blank())&NoLegend()
o(5*6, 5*1)
p+plot_layout(ncol = 6)


cell.sel = Cells(subset(seu, RNA_snn_res.0.9=='16_0'))
seu@meta.data[cell.sel, "persample_ann"] = 'cDC1'

cell.sel = Cells(subset(seu, RNA_snn_res.0.9=='16_1'))
seu@meta.data[cell.sel, "persample_ann"] = 'pDC'
Mac
# macrophages
o(5*5, 5*9)
FeaturePlot(seu, ncol = 5, pt.size=0.01,
            features = c("CD14",'LYZ',"FCGR3A",
'OLR1','CDKN1C','LILRB2',"ITGAL",
'CDKN1C','LILRB2','ITGAL',
'S100A12','PROK2','S100A8','VCAN',
'NT5E','ANGPTL4','CXCL5','BAG3',
'DNASE2',
'MMP7','TIMP3','CHI3L1','FABP5',
'CHIT1','GDF15','CTSK',
'CCL18','PLTP','CD209','F13A1',
'FABP4','RBP4','PPARG','MARCO',
'CXCL12','IGSF21','C3',
'CXCL9','CXCL10','CXCL11','GBP1',
'CCL17',"CLEC10A",
"TOP2A","MKI67",'CDK1')
)&theme(
legend.position=c(0.8,0.8),
axis.line = element_blank(),
axis.title = element_blank(),axis.text = element_blank(), axis.ticks=element_blank()
)
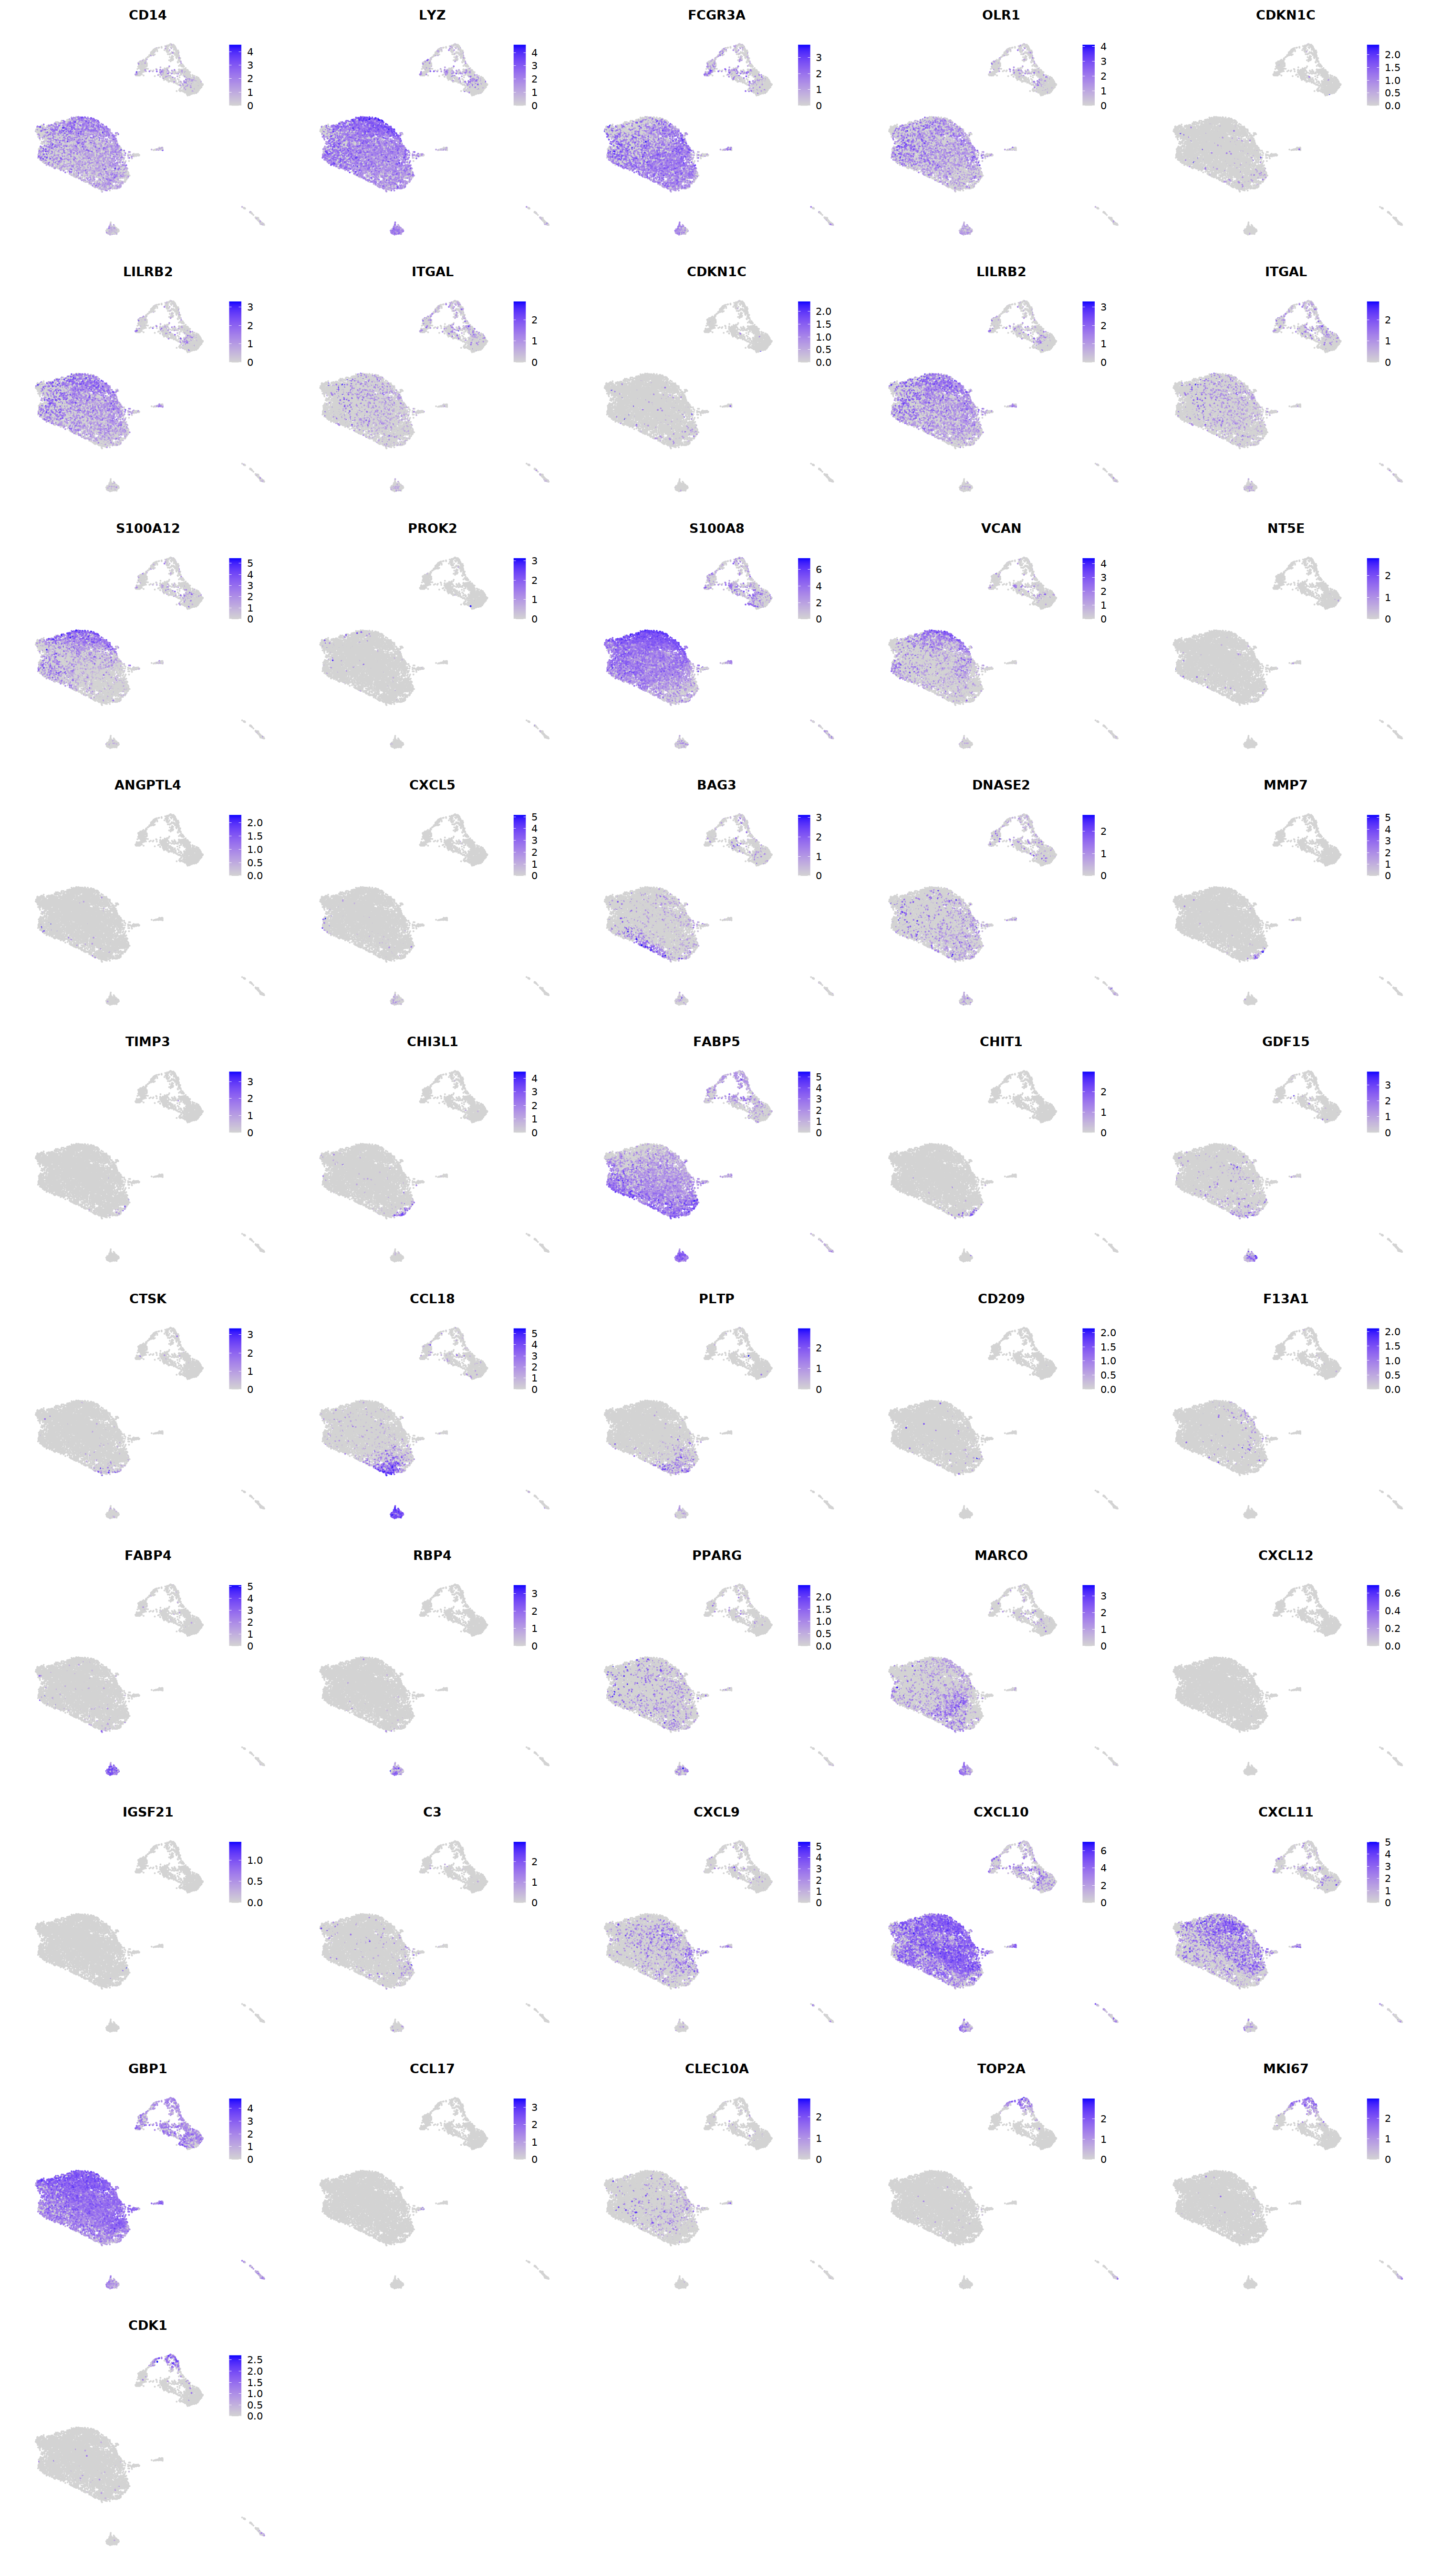
cell.sel = Cells(subset(seu, persample_ann=='Mye'))
seu@meta.data[cell.sel, "persample_ann"] = 'macrophage'
T
# T cell markers
o(5*5, 5*7)
FeaturePlot(seu, ncol = 5,pt.size=0.01,
features = c("CD3D","CD3E",'TRAC','TRBC1','TRGC2',
             'TRGC1','TRDC',"CD4",'CD8A','CD8B',
             'RORC','FOXP3','CD28','IL2RA',"CD44",
             'CD69','CD27','PRF1','GZMK','ID2',
             'RORC','GATA3','ZBTB16','IL7R','TBX21',
             'NKG7','GNLY','EOMES','KLRB1','TOX',
             "TOX2",'CXCR5','SELL','CD68','MT2A',
             'CST7','HOPX','GZMM','KLRD1','KLRC2',
             'KLRF1'), order=F)&theme(axis.line = element_blank(),
axis.title = element_blank(),axis.text = element_blank(), axis.ticks=element_blank()
)
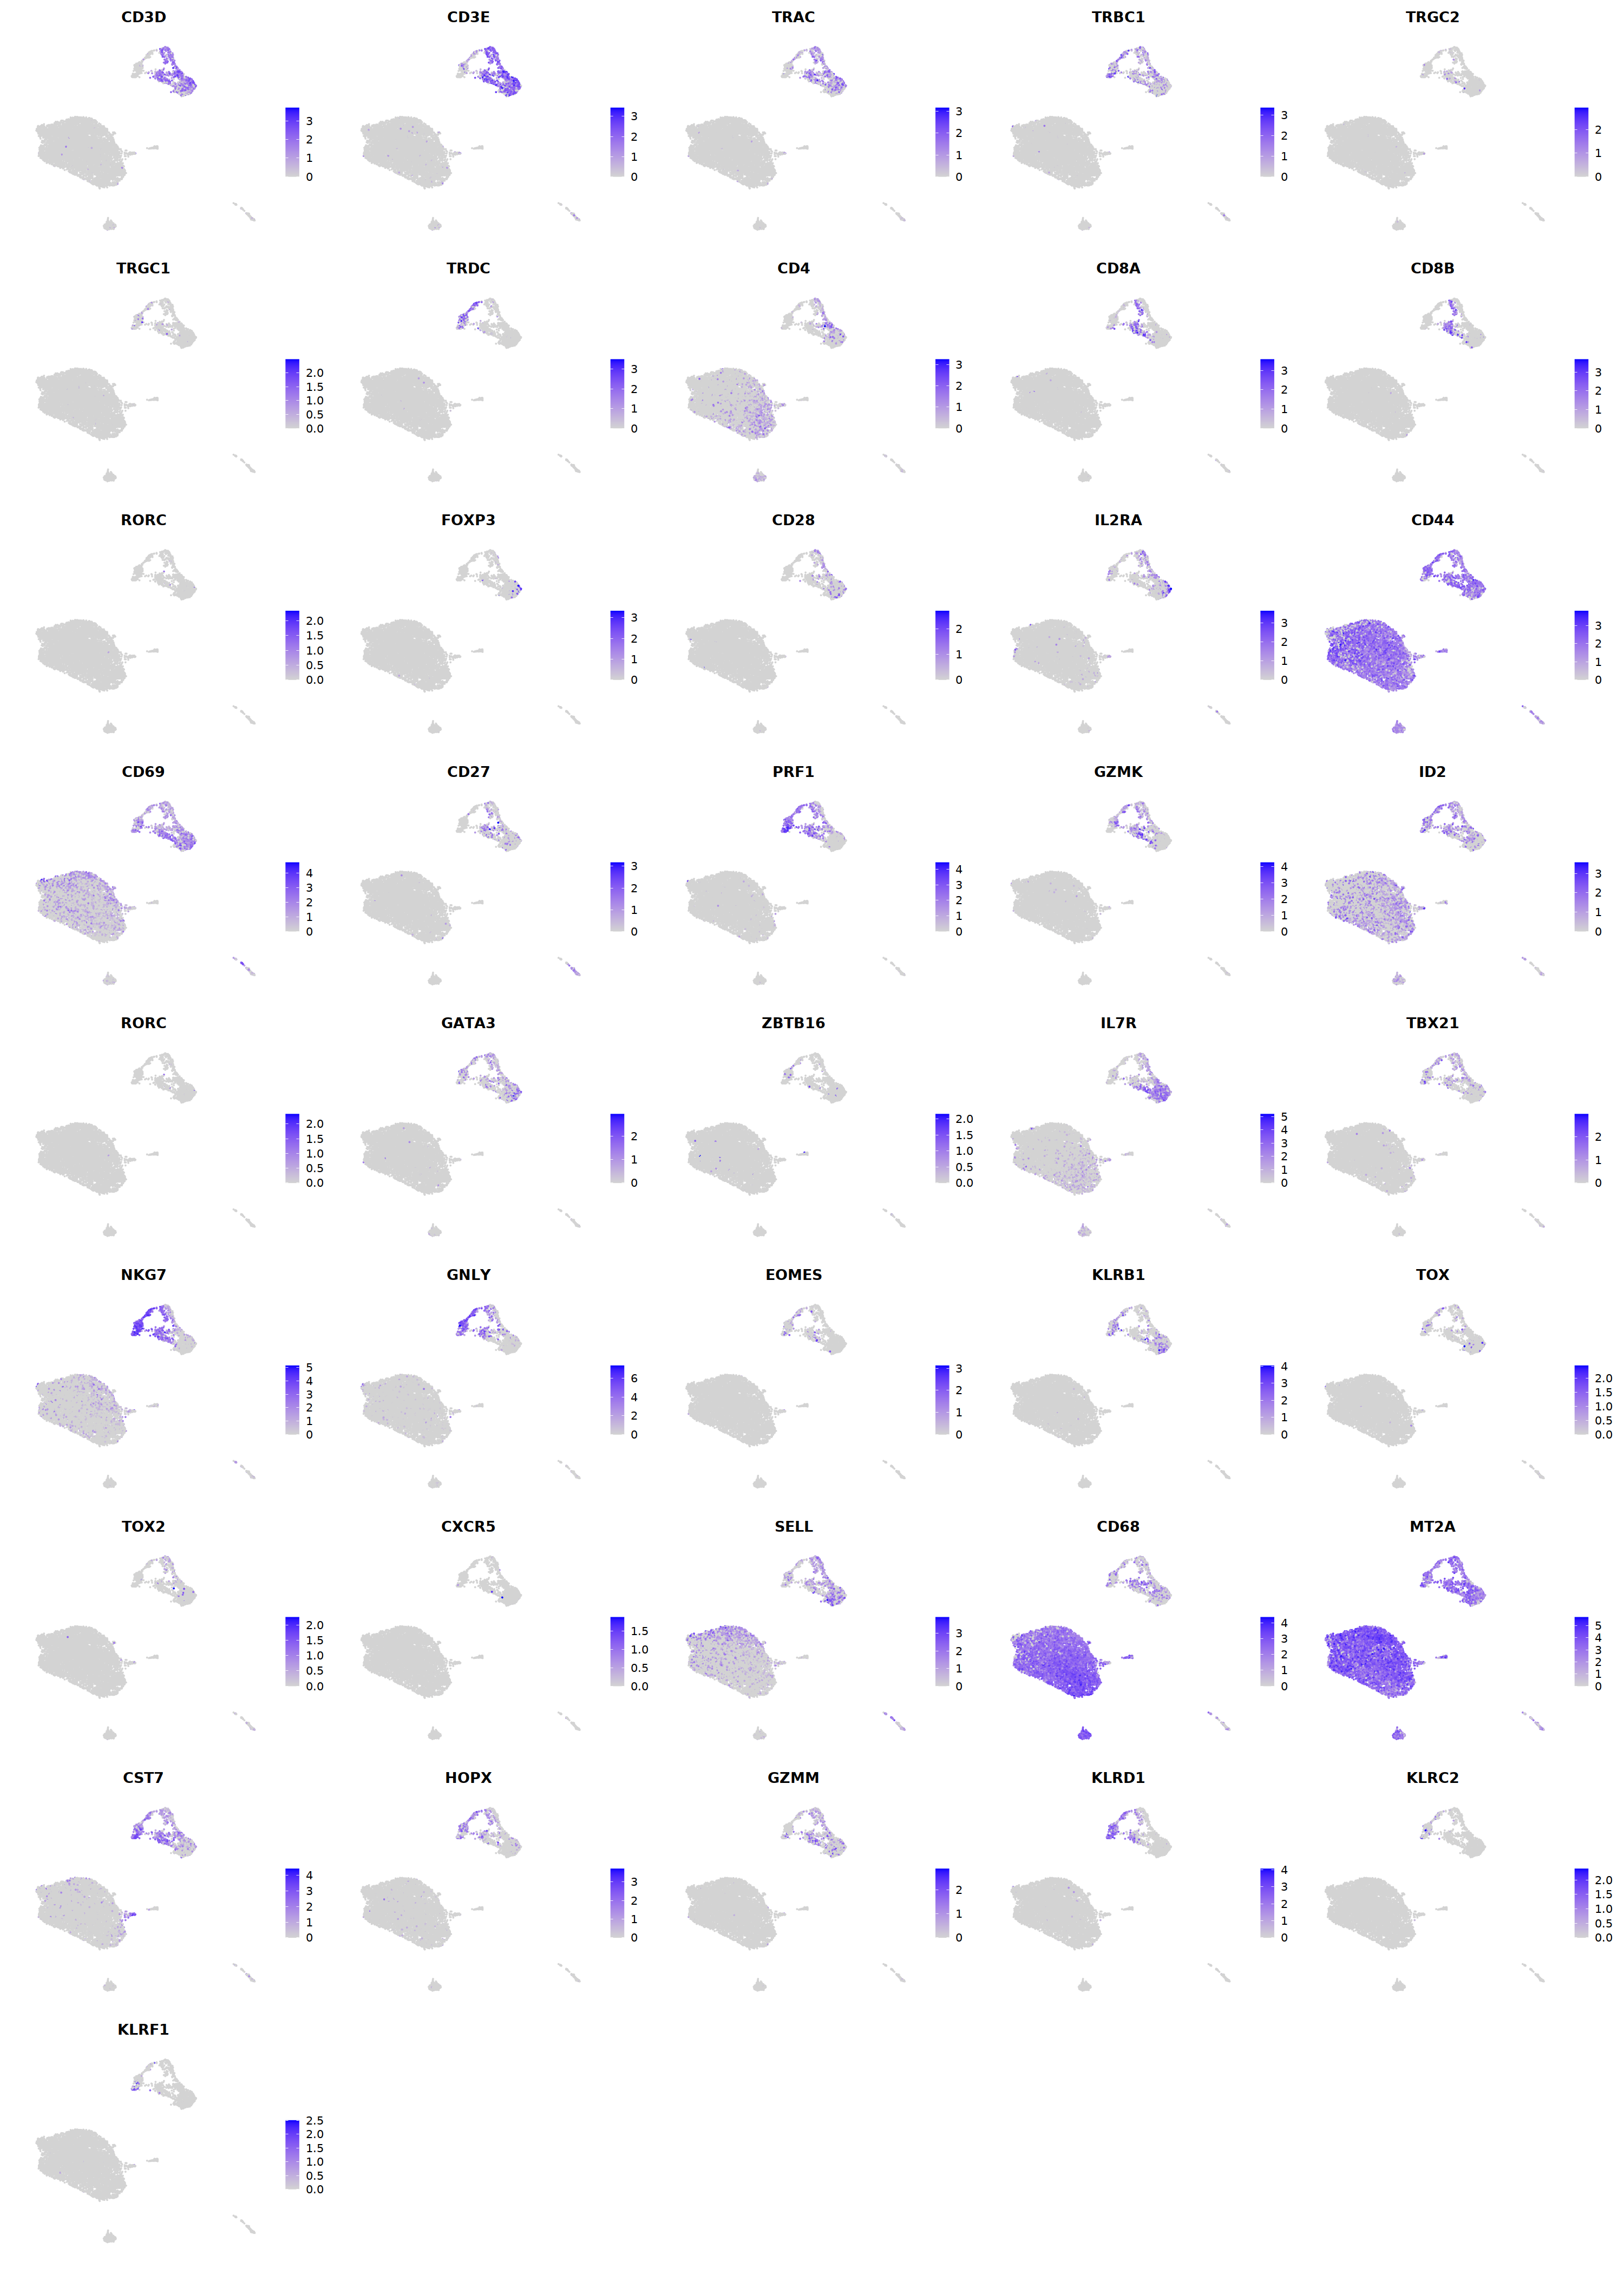
cell.sel = Cells(subset(seu, RNA_snn_res.0.9=='11'))
seu@meta.data[cell.sel, "persample_ann"] = 'NK'

cell.sel = Cells(subset(seu, RNA_snn_res.0.9=='17'))
seu@meta.data[cell.sel, "persample_ann"] = 'NK'
cell.sel = Cells(subset(seu, RNA_snn_res.0.9=='13'))
seu@meta.data[cell.sel, "persample_ann"] = 'T CD8'
o(8,7);DimPlot(seu, group.by='persample_ann', label=T, repel=T, pt.size=0.1)
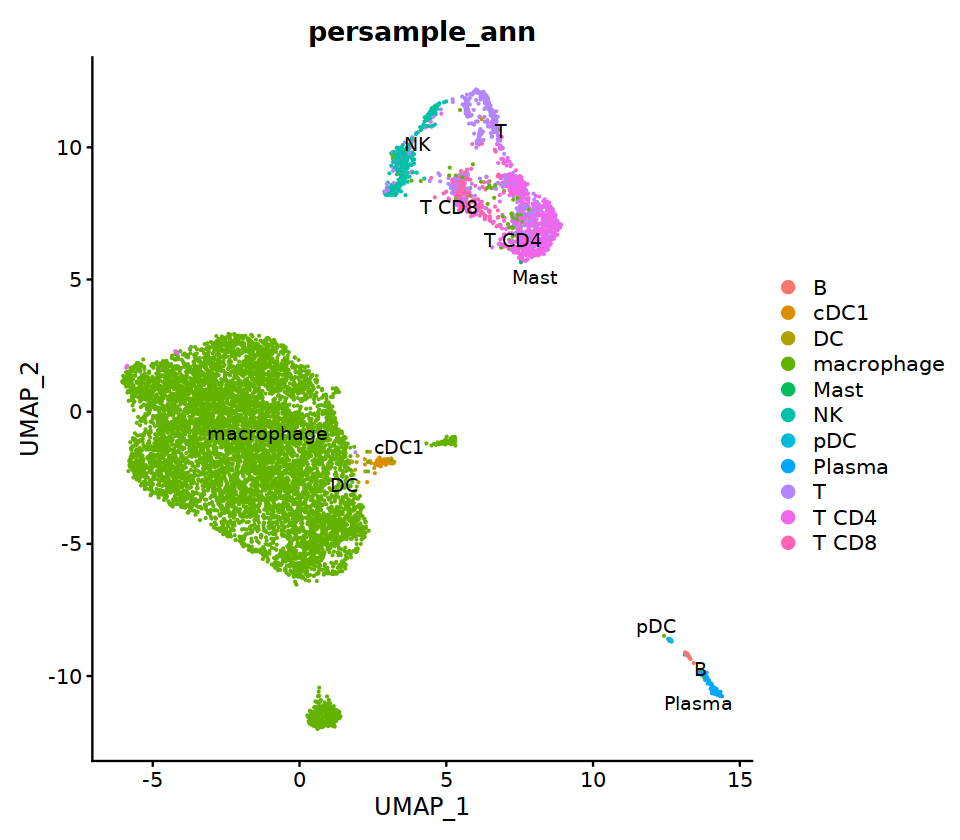
seu -> immune.list[[sample_name]]
S3
# context switching
sample_name='S3'

seu= immune.list[[sample_name]]
group.by= 'RNA_snn_res.0.9'

o(17,8)
ggarrange(
    DimPlot(seu, group.by=group.by, label=T,repel=T, label.size = 5, cols=manymanycolors),
    DimPlot(seu, group.by='integrated_ann',  label=T,repel=T, label.size = 5),
    nrow=1, ncol=2
)
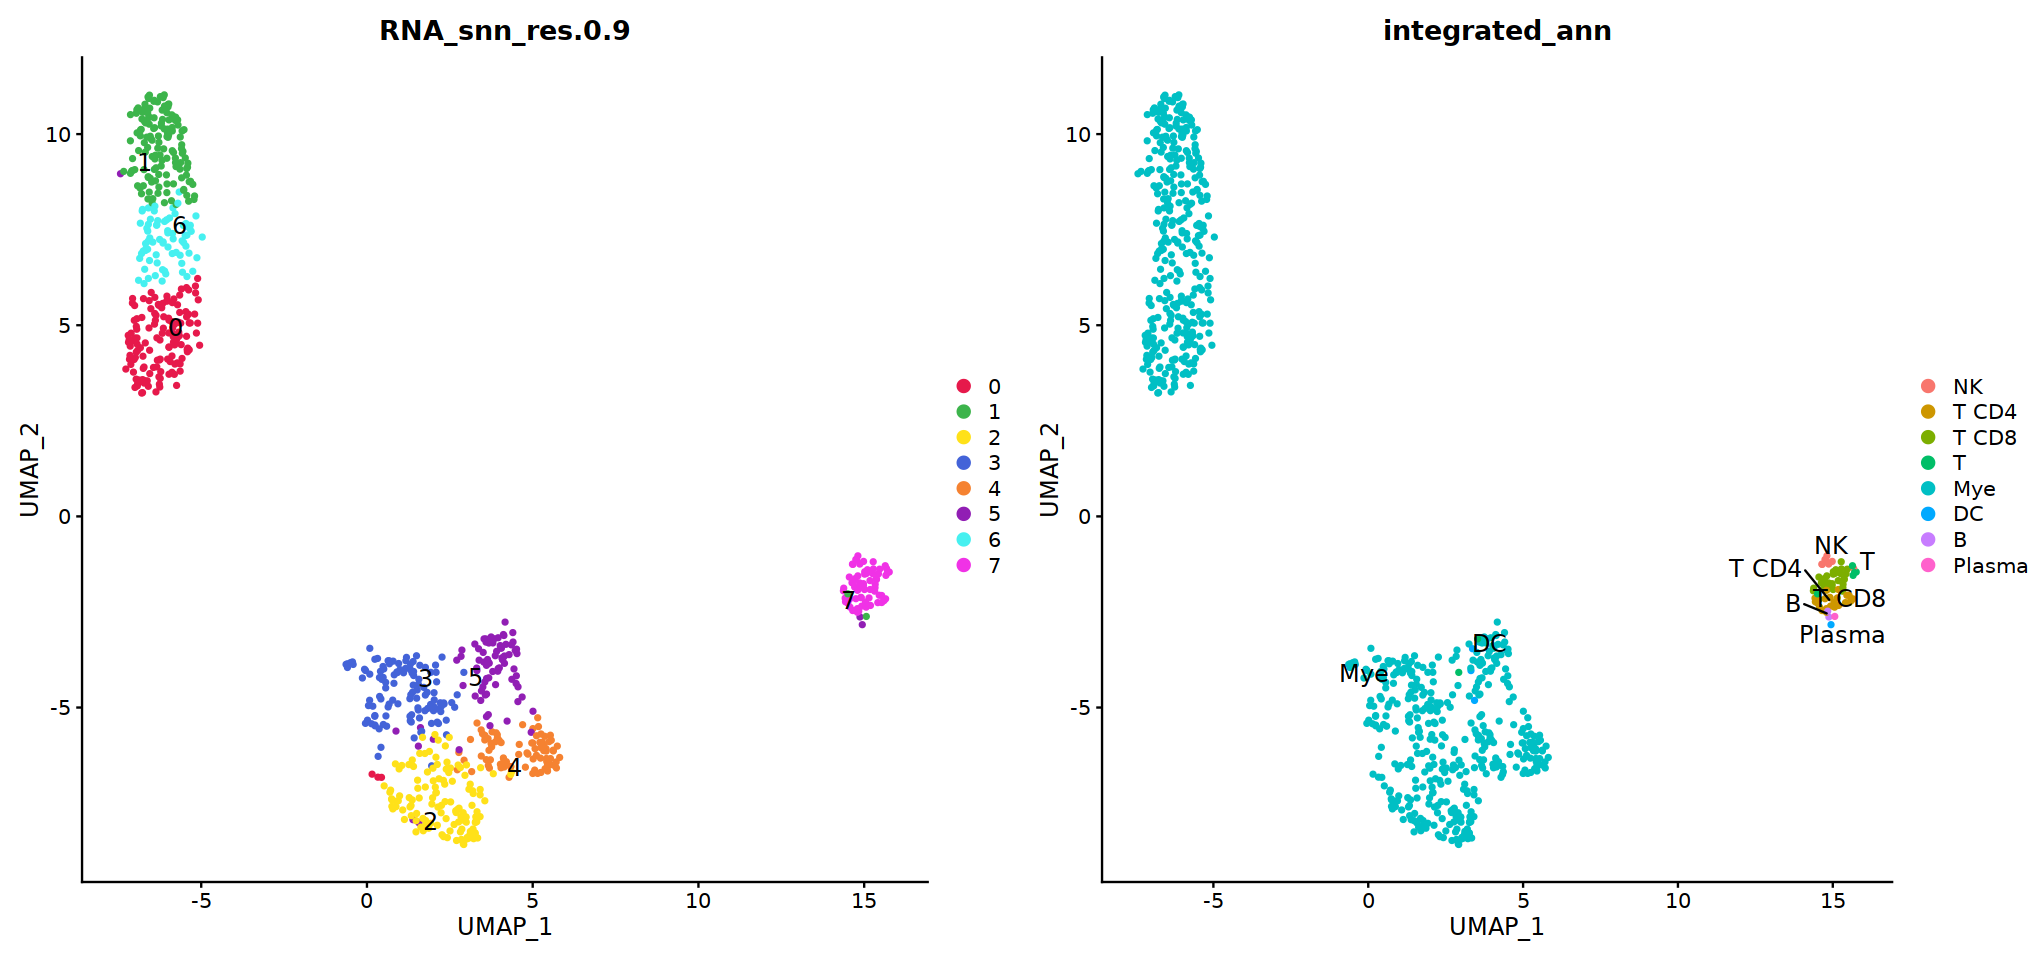
o(10,5)
FeaturePlot(seu, pt.size=0.1, features = c('CXCR2','FCGR3B'))
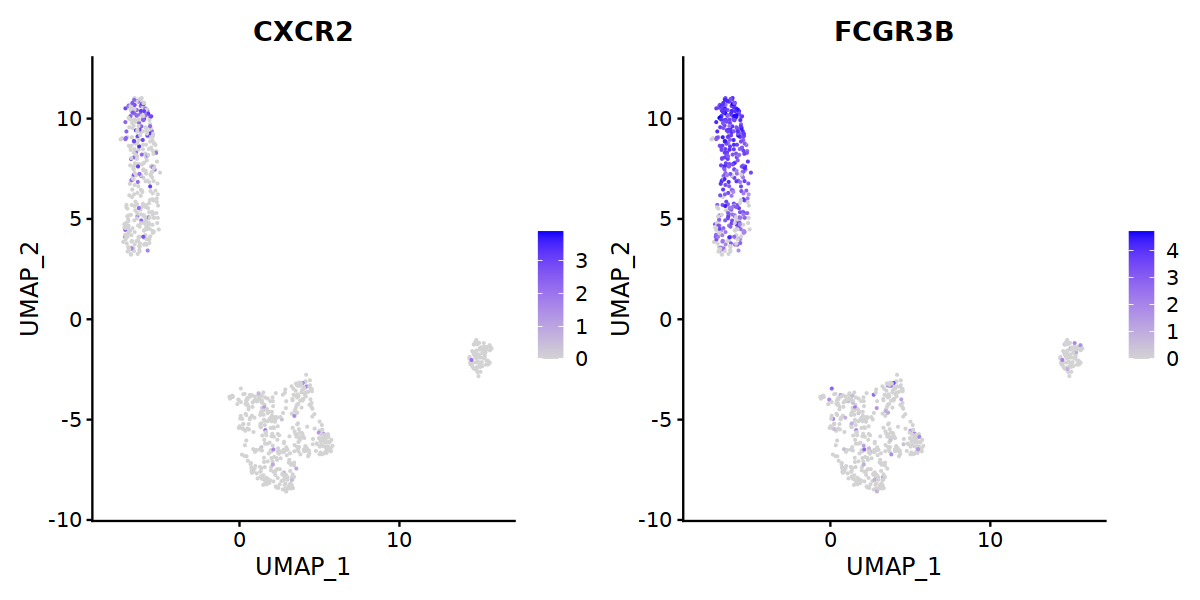
# adopt integrated_ann first
seu@meta.data[, "persample_ann"] = as.character(seu@meta.data[, "integrated_ann"] )
cell.sel = Cells(subset(seu, RNA_snn_res.0.9=='0'))
seu@meta.data[cell.sel, "persample_ann"] = 'Neu'

cell.sel = Cells(subset(seu, RNA_snn_res.0.9=='1'))
seu@meta.data[cell.sel, "persample_ann"] = 'Neu'

cell.sel = Cells(subset(seu, RNA_snn_res.0.9=='6'))
seu@meta.data[cell.sel, "persample_ann"] = 'Neu'
1
Idents(seu) <- group.by
deg = FindMarkers(seu,assay='RNA',slot='data',only.pos=T, ident.1=c('0','1','6'), ident.2=c('2','3','4','5'))
deg
| p_val | avg_log2FC | pct.1 | pct.2 | p_val_adj | |
|---|---|---|---|---|---|
| <dbl> | <dbl> | <dbl> | <dbl> | <dbl> | |
| IFITM2 | 5.804710e-116 | 3.9010960 | 0.983 | 0.882 | 1.388254e-111 |
| H3F3A | 8.075636e-107 | 2.5658289 | 0.989 | 0.882 | 1.931369e-102 |
| IFITM3 | 2.948642e-103 | 2.1478694 | 0.994 | 0.978 | 7.051973e-99 |
| H3F3B | 7.633565e-102 | 2.4203757 | 0.997 | 0.947 | 1.825643e-97 |
| NAMPT | 6.027546e-98 | 2.5773716 | 0.975 | 0.812 | 1.441548e-93 |
| FCGR3B | 2.895525e-95 | 4.3213919 | 0.808 | 0.106 | 6.924938e-91 |
| IFITM1 | 2.945446e-85 | 2.6343762 | 0.977 | 0.865 | 7.044328e-81 |
| NEAT1 | 1.885165e-84 | 1.7967672 | 0.992 | 0.836 | 4.508561e-80 |
| SRGN | 9.004459e-81 | 1.8611404 | 0.972 | 0.957 | 2.153506e-76 |
| CARD16 | 5.790015e-76 | 2.3923271 | 0.913 | 0.725 | 1.384740e-71 |
| SAT1 | 2.631055e-72 | 2.0646660 | 0.994 | 0.998 | 6.292430e-68 |
| S100A8 | 2.265413e-68 | 3.2407889 | 0.924 | 0.611 | 5.417961e-64 |
| LITAF | 6.258092e-67 | 2.0114009 | 0.910 | 0.841 | 1.496685e-62 |
| HCAR3 | 1.700792e-66 | 4.1361180 | 0.642 | 0.087 | 4.067614e-62 |
| TAOK1 | 8.235967e-64 | 1.3444990 | 1.000 | 0.988 | 1.969714e-59 |
| ANP32A | 1.540944e-63 | 3.2480719 | 0.761 | 0.343 | 3.685322e-59 |
| HLA-C | 2.109675e-63 | 1.0309840 | 0.992 | 0.986 | 5.045500e-59 |
| S100A9 | 2.444295e-62 | 2.5409115 | 0.918 | 0.732 | 5.845775e-58 |
| CSF3R | 3.184975e-59 | 3.2454966 | 0.744 | 0.348 | 7.617186e-55 |
| FPR1 | 2.008789e-58 | 2.7178719 | 0.749 | 0.326 | 4.804220e-54 |
| MXD1 | 6.786446e-57 | 2.6081247 | 0.783 | 0.476 | 1.623046e-52 |
| HLA-E | 4.568255e-56 | 1.2081270 | 0.977 | 0.952 | 1.092544e-51 |
| G0S2 | 2.787460e-53 | 2.6729435 | 0.769 | 0.324 | 6.666489e-49 |
| B2M | 7.264078e-52 | 0.6815484 | 1.000 | 0.998 | 1.737277e-47 |
| RNF213 | 7.952964e-51 | 1.6187186 | 0.899 | 0.809 | 1.902031e-46 |
| IFIT3 | 9.238463e-49 | 1.9302388 | 0.910 | 0.829 | 2.209471e-44 |
| IFIT2 | 3.064961e-46 | 2.4565307 | 0.876 | 0.783 | 7.330160e-42 |
| HCAR2 | 4.730504e-46 | 3.2052117 | 0.490 | 0.060 | 1.131347e-41 |
| ISG20 | 1.728222e-44 | 1.8054301 | 0.868 | 0.742 | 4.133216e-40 |
| PLEK | 3.096812e-44 | 1.7979536 | 0.887 | 0.821 | 7.406337e-40 |
| ⋮ | ⋮ | ⋮ | ⋮ | ⋮ | ⋮ |
| TBC1D7 | 0.7347428 | 0.9158864 | 0.200 | 0.232 | 1 |
| PIM3 | 0.7352975 | 0.4168175 | 0.473 | 0.713 | 1 |
| SLC20A1 | 0.7409701 | 1.0013708 | 0.214 | 0.280 | 1 |
| ZNF292 | 0.7469231 | 0.5704103 | 0.096 | 0.114 | 1 |
| OAS1 | 0.7473371 | 0.2799151 | 0.518 | 0.785 | 1 |
| RBCK1 | 0.7527527 | 0.9552065 | 0.313 | 0.452 | 1 |
| MCL1 | 0.7599816 | 0.4768013 | 0.456 | 0.710 | 1 |
| CLEC4A | 0.7700650 | 0.6964573 | 0.115 | 0.121 | 1 |
| BATF2 | 0.7793755 | 0.6006201 | 0.104 | 0.123 | 1 |
| FCGR3A | 0.7862630 | 0.7285176 | 0.361 | 0.512 | 1 |
| LYSMD2 | 0.7981506 | 0.8552369 | 0.293 | 0.415 | 1 |
| WIPF1 | 0.8136528 | 0.7772868 | 0.372 | 0.572 | 1 |
| ARID4B | 0.8398726 | 1.0327984 | 0.307 | 0.420 | 1 |
| GNG10 | 0.8419870 | 0.8636396 | 0.194 | 0.229 | 1 |
| NFE2L2 | 0.8504626 | 0.5334789 | 0.496 | 0.751 | 1 |
| LILRB3 | 0.8851005 | 0.8568838 | 0.361 | 0.517 | 1 |
| GBP3 | 0.8929855 | 1.1814620 | 0.245 | 0.321 | 1 |
| AC116366.3 | 0.8981018 | 0.9170657 | 0.203 | 0.244 | 1 |
| AL645608.8 | 0.9026063 | 0.6722661 | 0.096 | 0.109 | 1 |
| IGSF6 | 0.9038517 | 0.7039621 | 0.454 | 0.671 | 1 |
| IRF2 | 0.9052059 | 0.7353076 | 0.383 | 0.563 | 1 |
| DDAH2 | 0.9113649 | 1.0005230 | 0.279 | 0.382 | 1 |
| GBP2 | 0.9274209 | 0.7020801 | 0.400 | 0.575 | 1 |
| SP100 | 0.9411885 | 0.6751131 | 0.403 | 0.628 | 1 |
| HELB | 0.9466045 | 0.6574290 | 0.093 | 0.104 | 1 |
| AIM2 | 0.9497696 | 0.8201739 | 0.152 | 0.179 | 1 |
| SAMSN1 | 0.9614460 | 0.5362301 | 0.420 | 0.589 | 1 |
| ZNFX1 | 0.9719498 | 0.8052303 | 0.363 | 0.539 | 1 |
| TFEC | 0.9783553 | 0.7030795 | 0.406 | 0.614 | 1 |
| TIMM10 | 0.9941355 | 0.8952288 | 0.149 | 0.174 | 1 |
T
# T cell markers
o(5*5, 5*7)
FeaturePlot(seu, ncol = 5,pt.size=0.01,
features = c("CD3D","CD3E",'TRAC','TRBC1','TRGC2',
             'TRGC1','TRDC',"CD4",'CD8A','CD8B',
             'RORC','FOXP3','CD28','IL2RA',"CD44",
             'CD69','CD27','PRF1','GZMK','ID2',
             'RORC','GATA3','ZBTB16','IL7R','TBX21',
             'NKG7','GNLY','EOMES','KLRB1','TOX',
             "TOX2",'CXCR5','SELL','CD68','MT2A',
             'CST7','HOPX','GZMM','KLRD1','KLRC2',
             'KLRF1'), order=F)&theme(axis.line = element_blank(),
axis.title = element_blank(),axis.text = element_blank(), axis.ticks=element_blank()
)
Warning message in FeaturePlot(seu, ncol = 5, pt.size = 0.01, features = c("CD3D", :
“All cells have the same value (0) of FOXP3.”
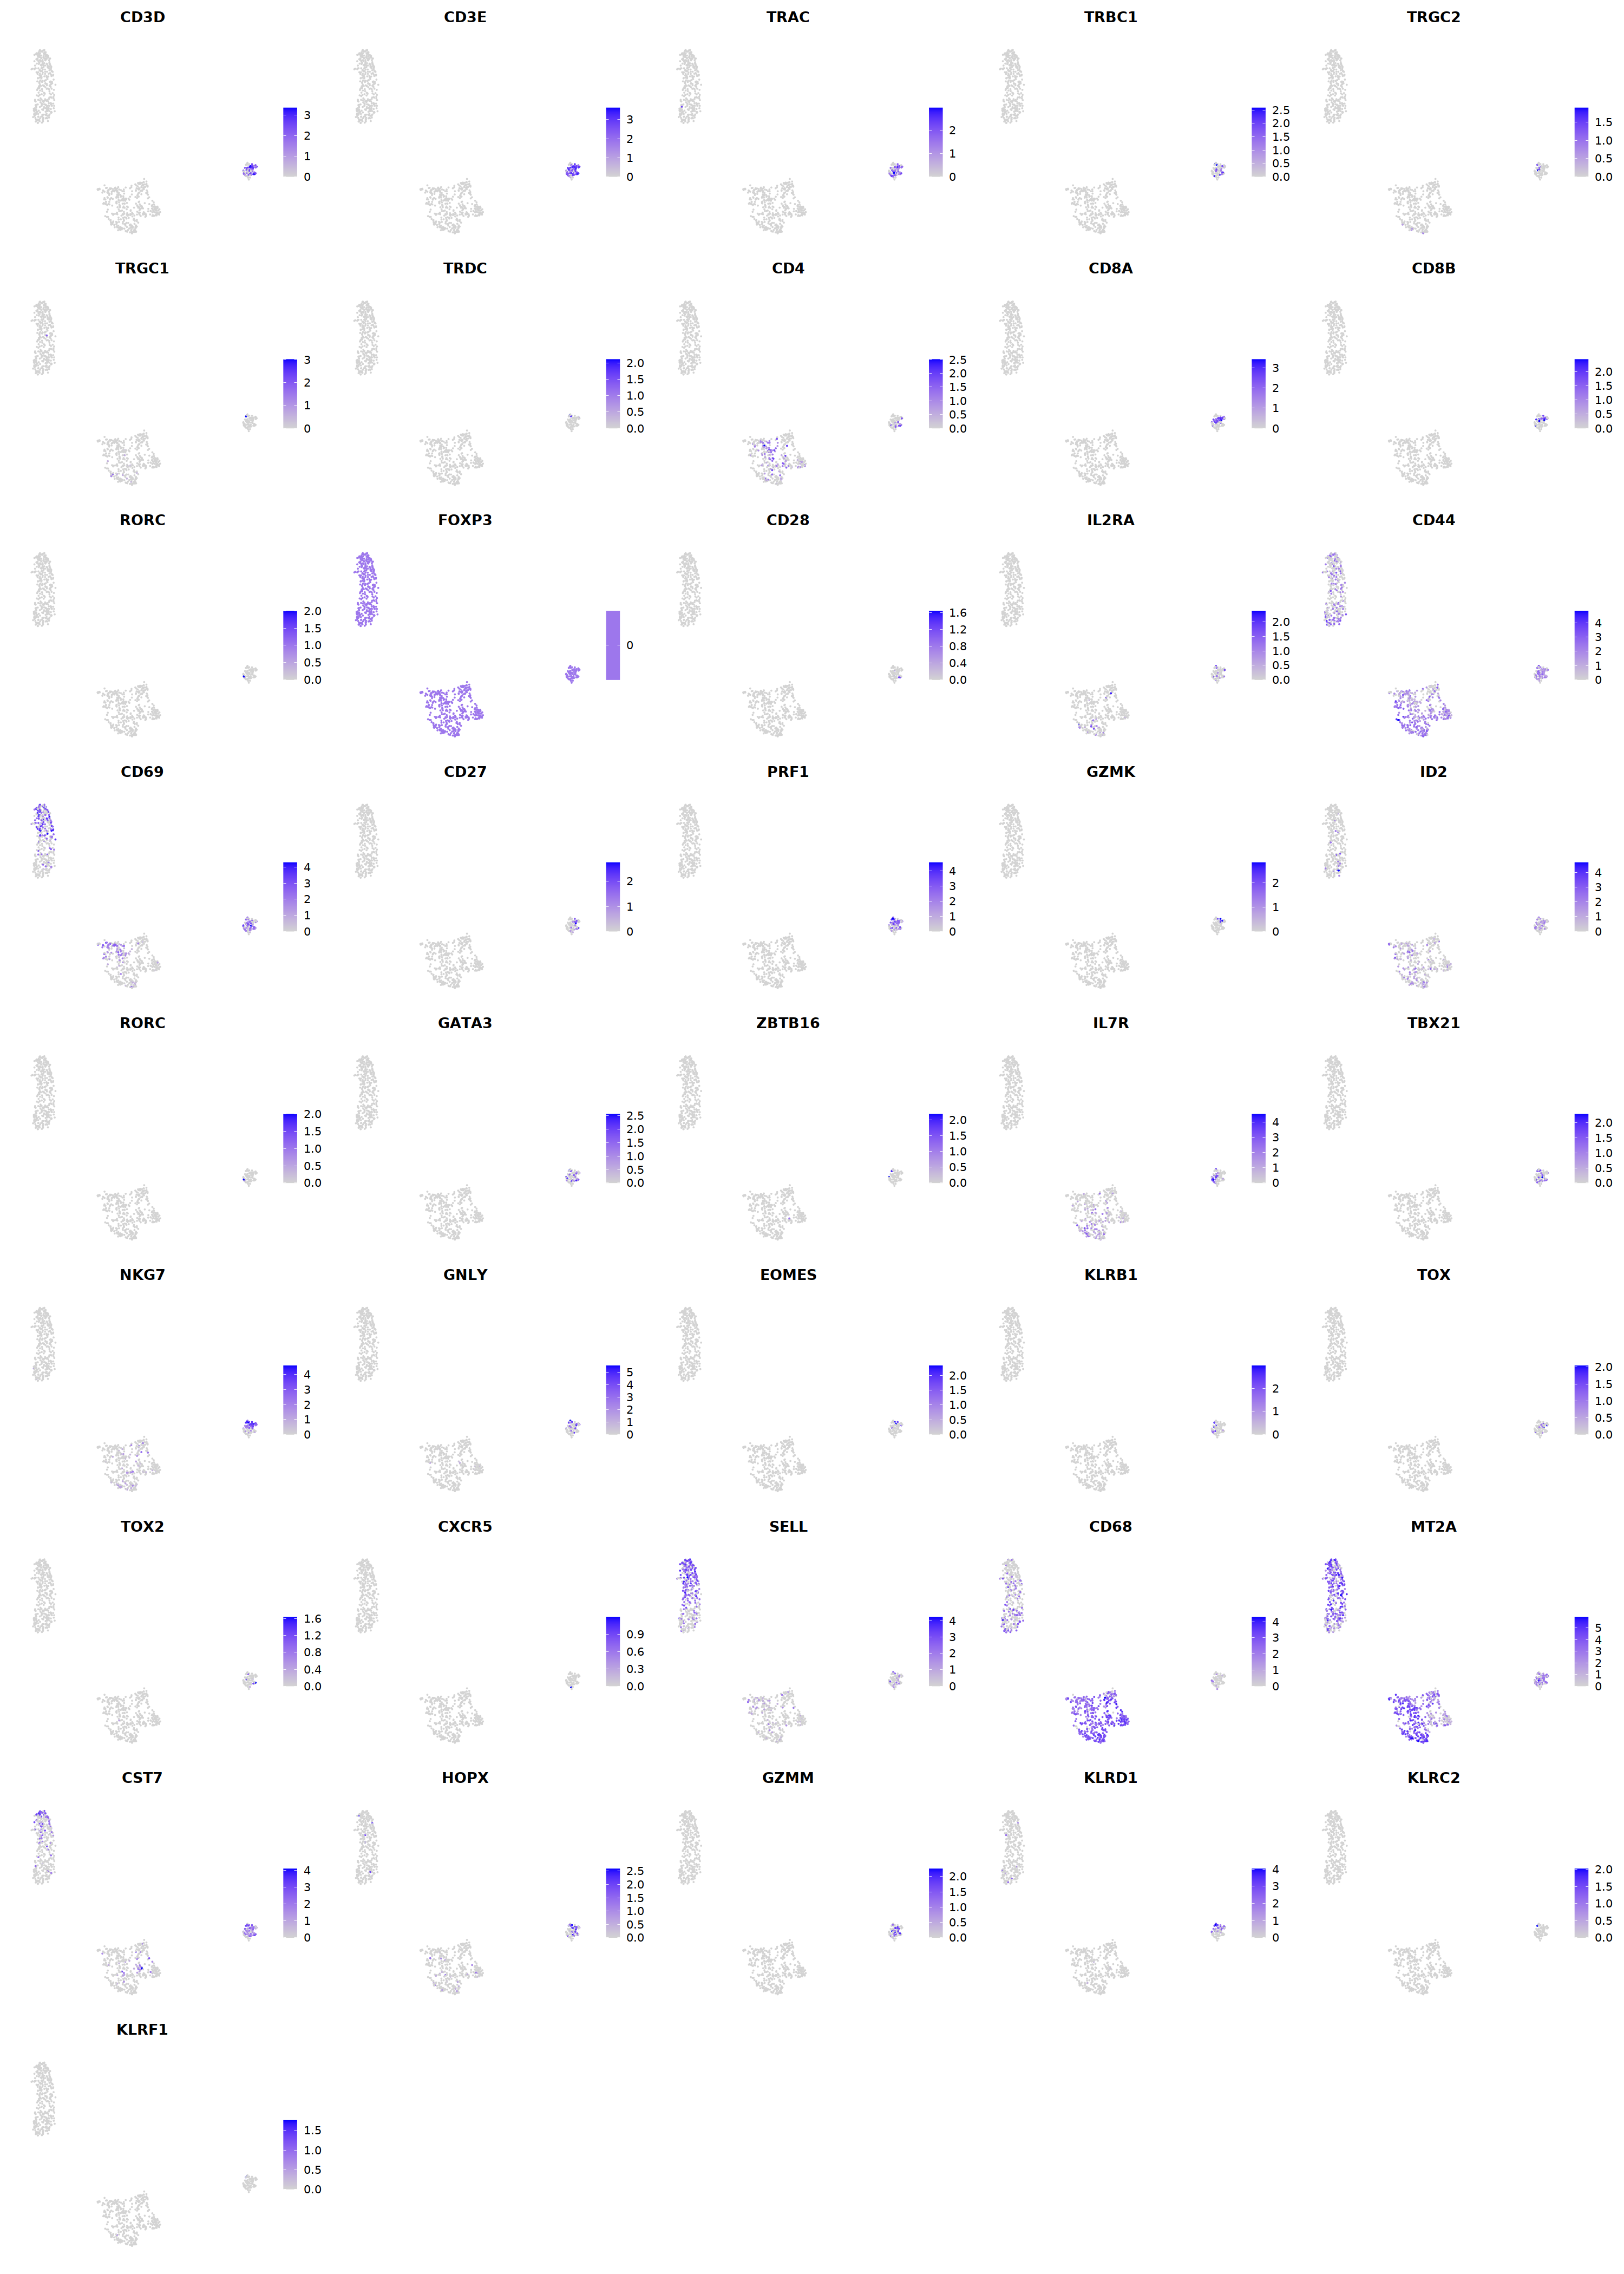
DC
# pDC
p=Nebulosa::plot_density(seu,c('IRF4','LILRA4','LILRB4','IRF8'),joint=T)&theme(
    axis.title=element_blank(),axis.ticks=element_blank(),axis.text = element_blank())&NoLegend()
o(5*6, 5*1)
p+plot_layout(ncol = 6)

# cDC1
p=Nebulosa::plot_density(seu,c('HLA-DQA1','BATF3','CADM1','XCR1'),joint=T)&theme(
    axis.title=element_blank(),axis.ticks=element_blank(),axis.text = element_blank())&NoLegend()
o(5*6, 5*1)
p+plot_layout(ncol = 6)


# cDC2
p=Nebulosa::plot_density(seu,c('CD14','PLD4','CD1C','CX3CR1','CLEC10A'),joint=T)&theme(
    axis.title=element_blank(),axis.ticks=element_blank(),axis.text = element_blank())&NoLegend()
o(5*6, 5*1)
p+plot_layout(ncol = 6)


o(5,5)
FeaturePlot(seu, features='ITGAX')
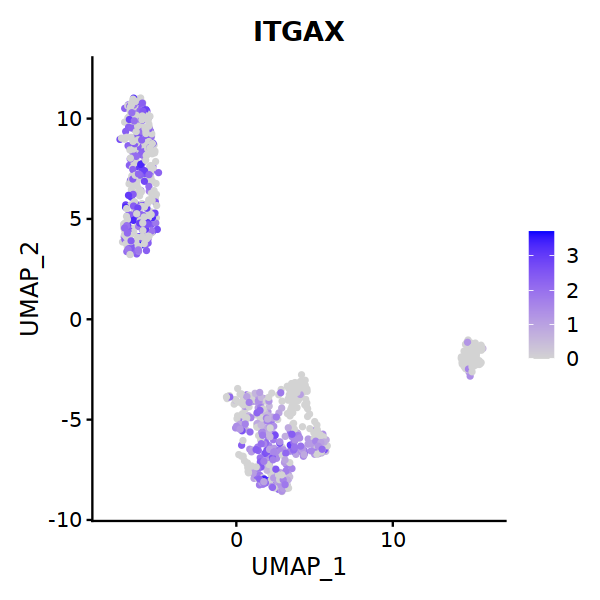
cell.sel = Cells(subset(seu, RNA_snn_res.0.9=='2'))
seu@meta.data[cell.sel, "persample_ann"] = 'macrophage'

cell.sel = Cells(subset(seu, RNA_snn_res.0.9=='3'))
seu@meta.data[cell.sel, "persample_ann"] = 'macrophage'

cell.sel = Cells(subset(seu, RNA_snn_res.0.9=='4'))
seu@meta.data[cell.sel, "persample_ann"] = 'cDC1'

cell.sel = Cells(subset(seu, RNA_snn_res.0.9=='5'))
seu@meta.data[cell.sel, "persample_ann"] = 'macrophage'
o(8,7);DimPlot(seu, group.by='persample_ann', label=T, repel=T, pt.size=0.1)
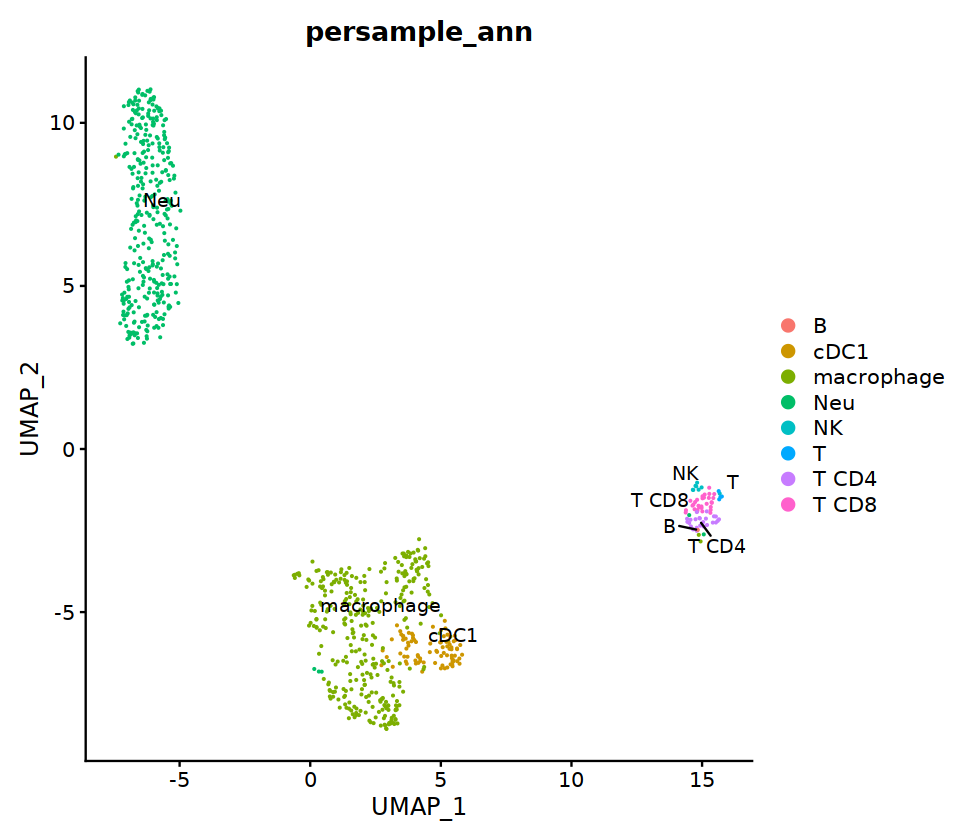
Mac
# macrophages
o(5*5, 5*9)
FeaturePlot(seu, ncol = 5, pt.size=0.01,
            features = c("CD14",'LYZ',"FCGR3A",
'OLR1','CDKN1C','LILRB2',"ITGAL",
'CDKN1C','LILRB2','ITGAL',
'S100A12','PROK2','S100A8','VCAN',
'NT5E','ANGPTL4','CXCL5','BAG3',
'DNASE2',
'MMP7','TIMP3','CHI3L1','FABP5',
'CHIT1','GDF15','CTSK',
'CCL18','PLTP','CD209','F13A1',
'FABP4','RBP4','PPARG','MARCO',
'CXCL12','IGSF21','C3',
'CXCL9','CXCL10','CXCL11','GBP1',
'CCL17',"CLEC10A",
"TOP2A","MKI67",'CDK1')
)&theme(
legend.position=c(0.8,0.8),
axis.line = element_blank(),
axis.title = element_blank(),axis.text = element_blank(), axis.ticks=element_blank()
)
Warning message in FeaturePlot(seu, ncol = 5, pt.size = 0.01, features = c("CD14", :
“All cells have the same value (0) of MMP7.”
Warning message in FeaturePlot(seu, ncol = 5, pt.size = 0.01, features = c("CD14", :
“All cells have the same value (0) of RBP4.”
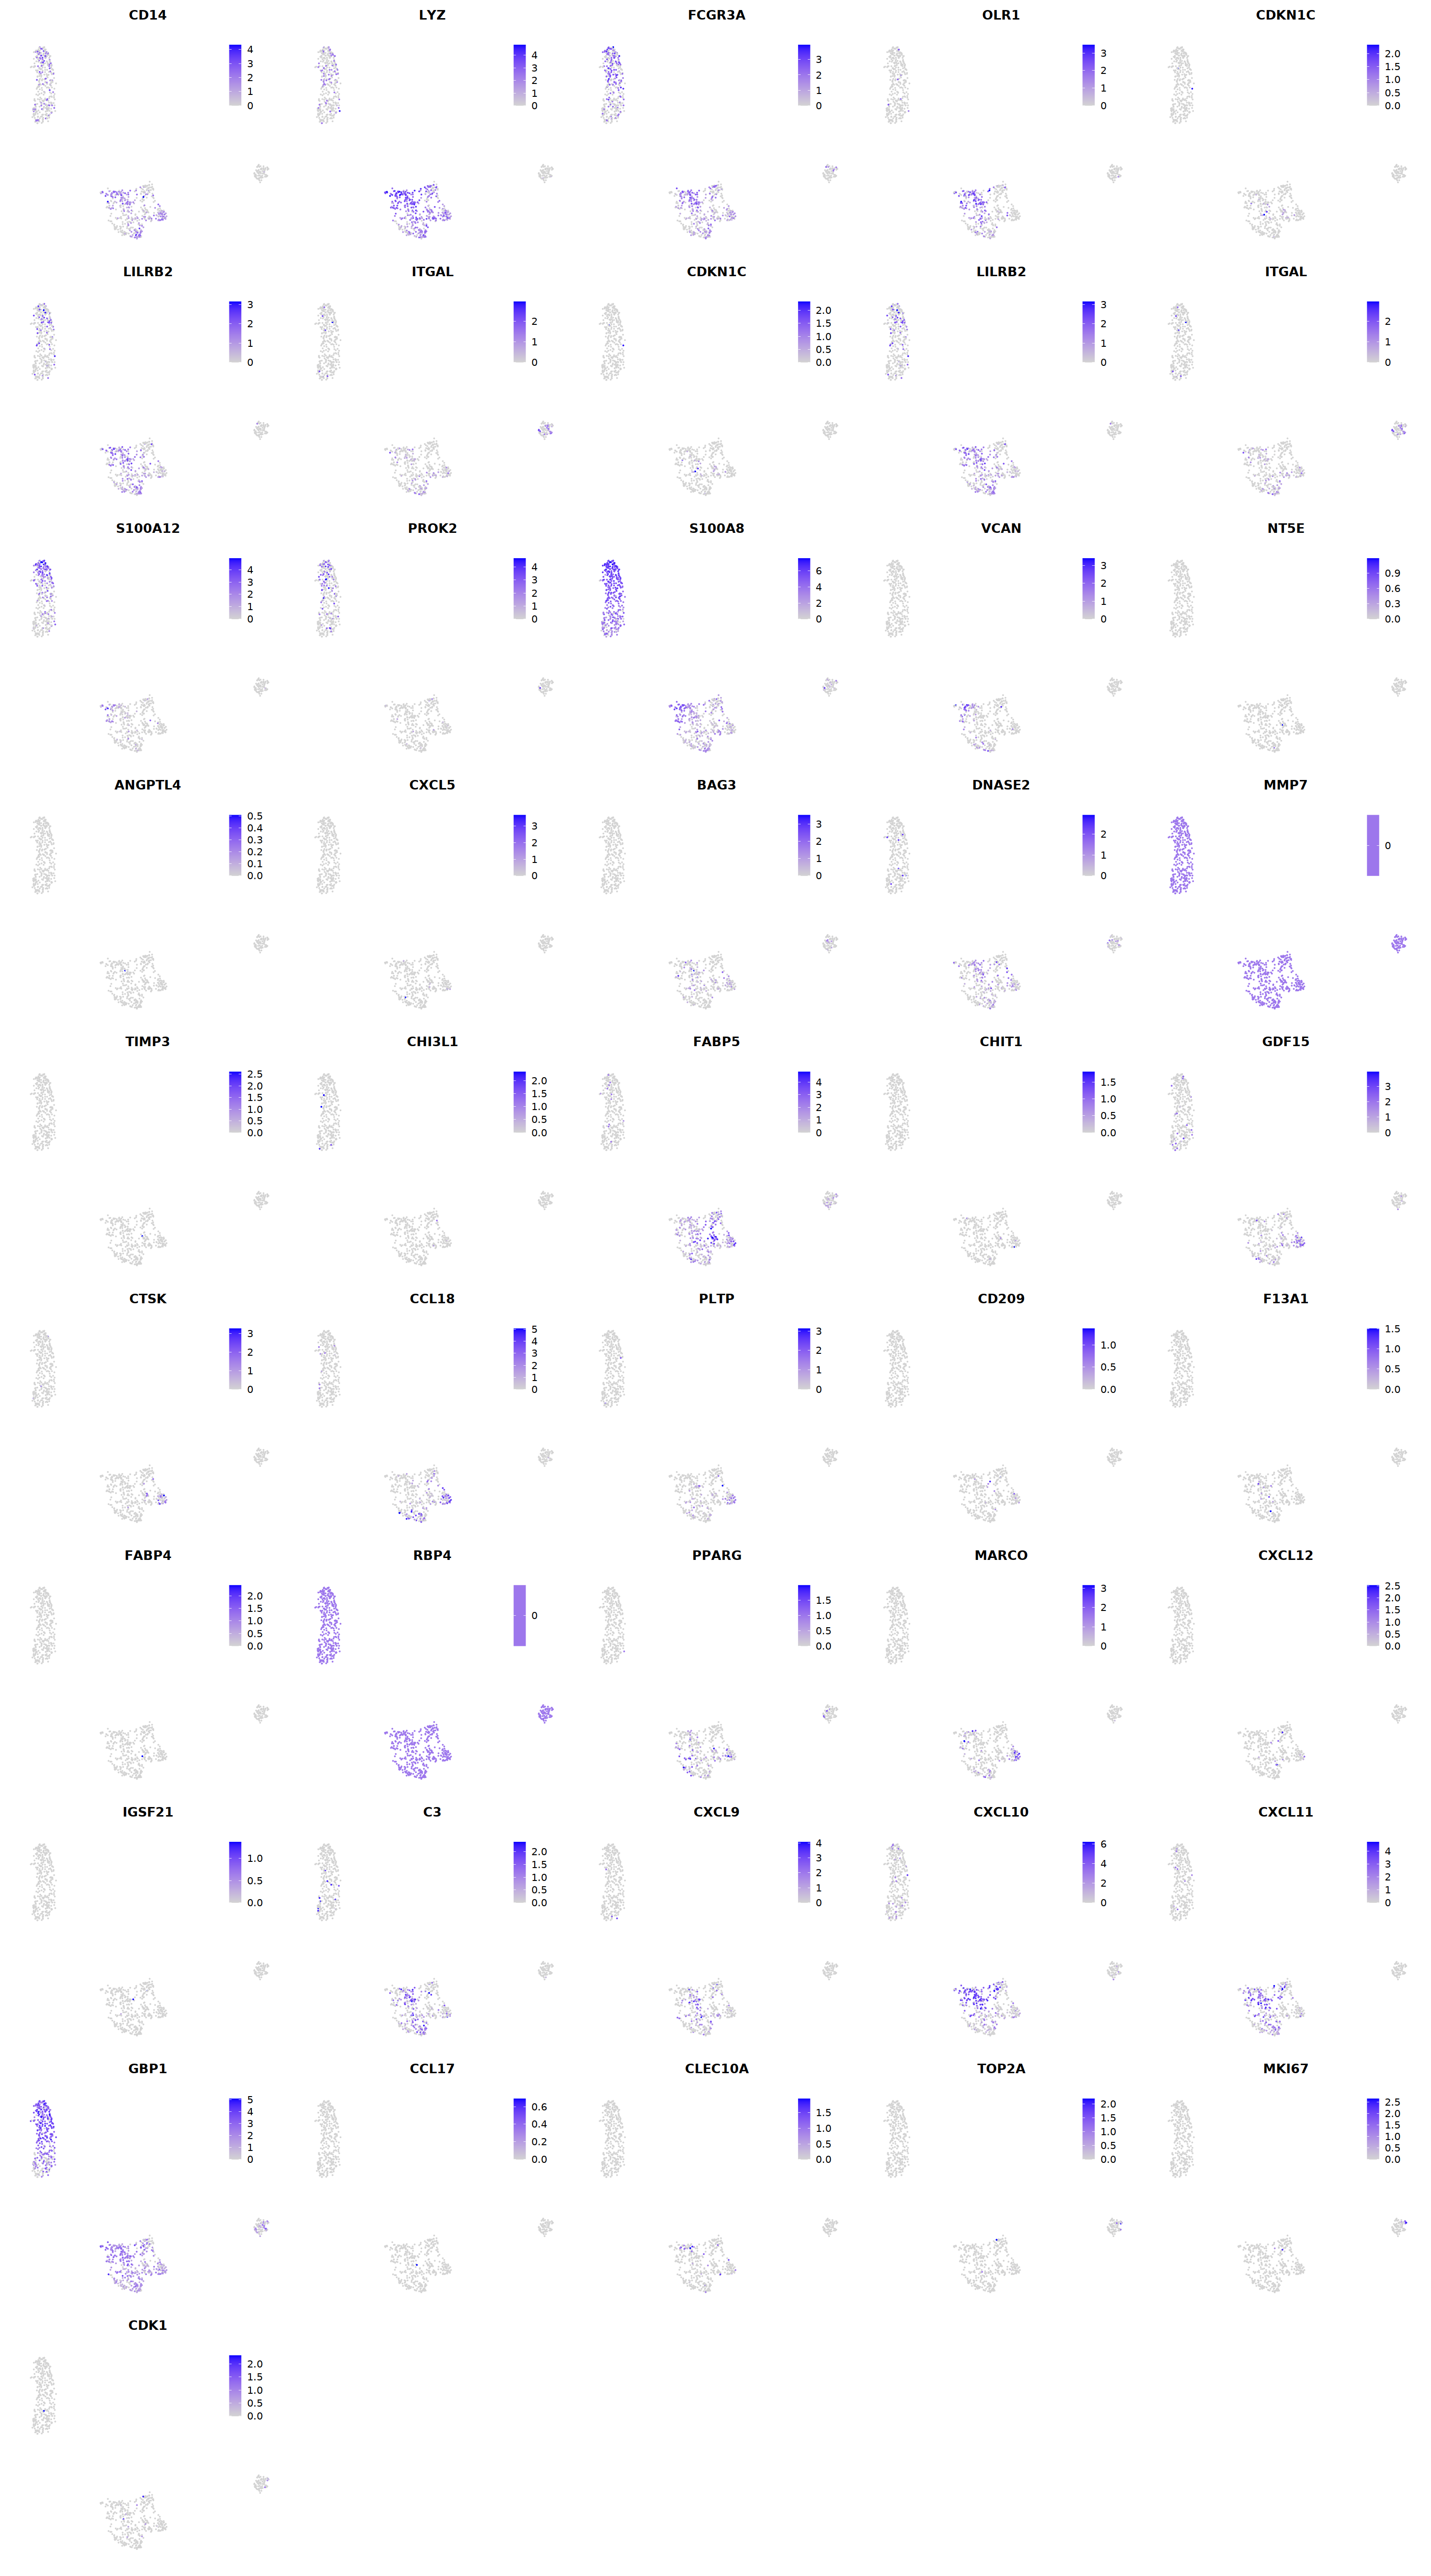
o(8,7);DimPlot(seu, group.by='persample_ann', label=T, repel=T, pt.size=0.1)
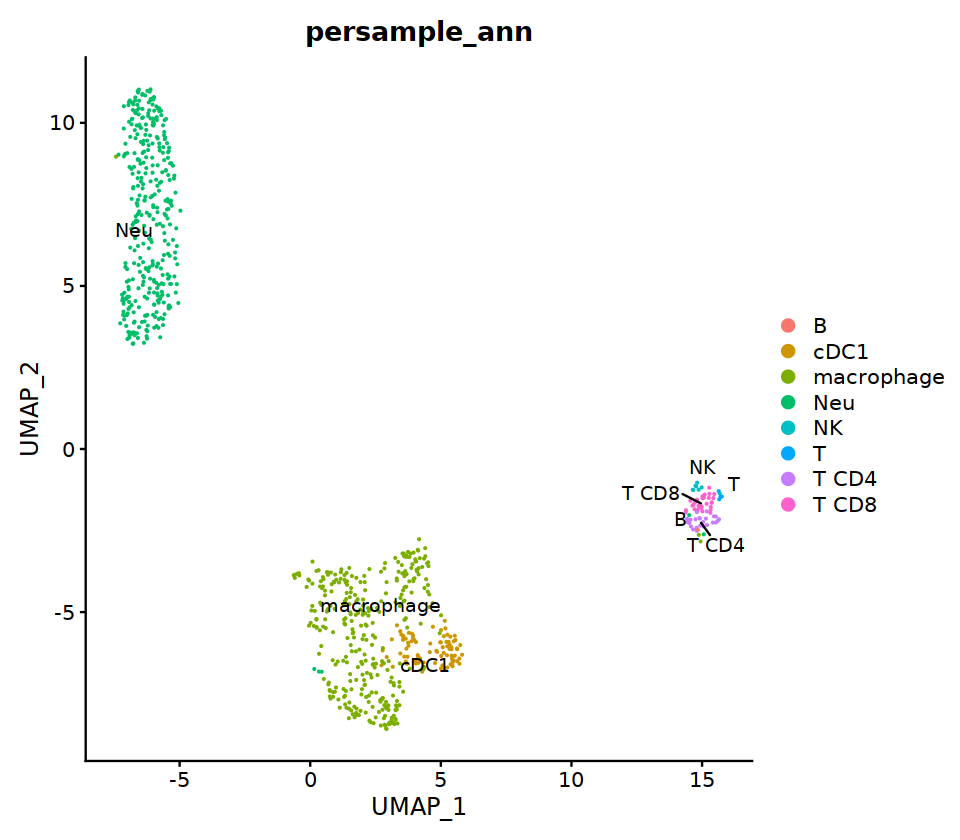
sample_name
seu -> immune.list[[sample_name]]
S4
# context switching
sample_name='S4'

seu= immune.list[[sample_name]]
group.by= 'RNA_snn_res.0.9'


Idents(seu)<-group.by
seu=FindSubCluster(seu, cluster='4',
                      graph.name="RNA_snn",
                      subcluster.name = "RNA_snn_res.0.9",  resolution = 0.5, algorithm = 1)
Idents(seu)<-group.by
seu=FindSubCluster(seu, cluster='5',
                      graph.name="RNA_snn",
                      subcluster.name = "RNA_snn_res.0.9",  resolution = 0.5, algorithm = 1)


o(17,8)
ggarrange(
    DimPlot(seu, group.by=group.by, label=T,repel=T, label.size = 5, cols=manymanycolors),
    DimPlot(seu, group.by='integrated_ann',  label=T,repel=T, label.size = 5),
    nrow=1, ncol=2
)
Modularity Optimizer version 1.3.0 by Ludo Waltman and Nees Jan van Eck

Number of nodes: 115
Number of edges: 3298

Running Louvain algorithm...
Maximum modularity in 10 random starts: 0.5600
Number of communities: 2
Elapsed time: 0 seconds
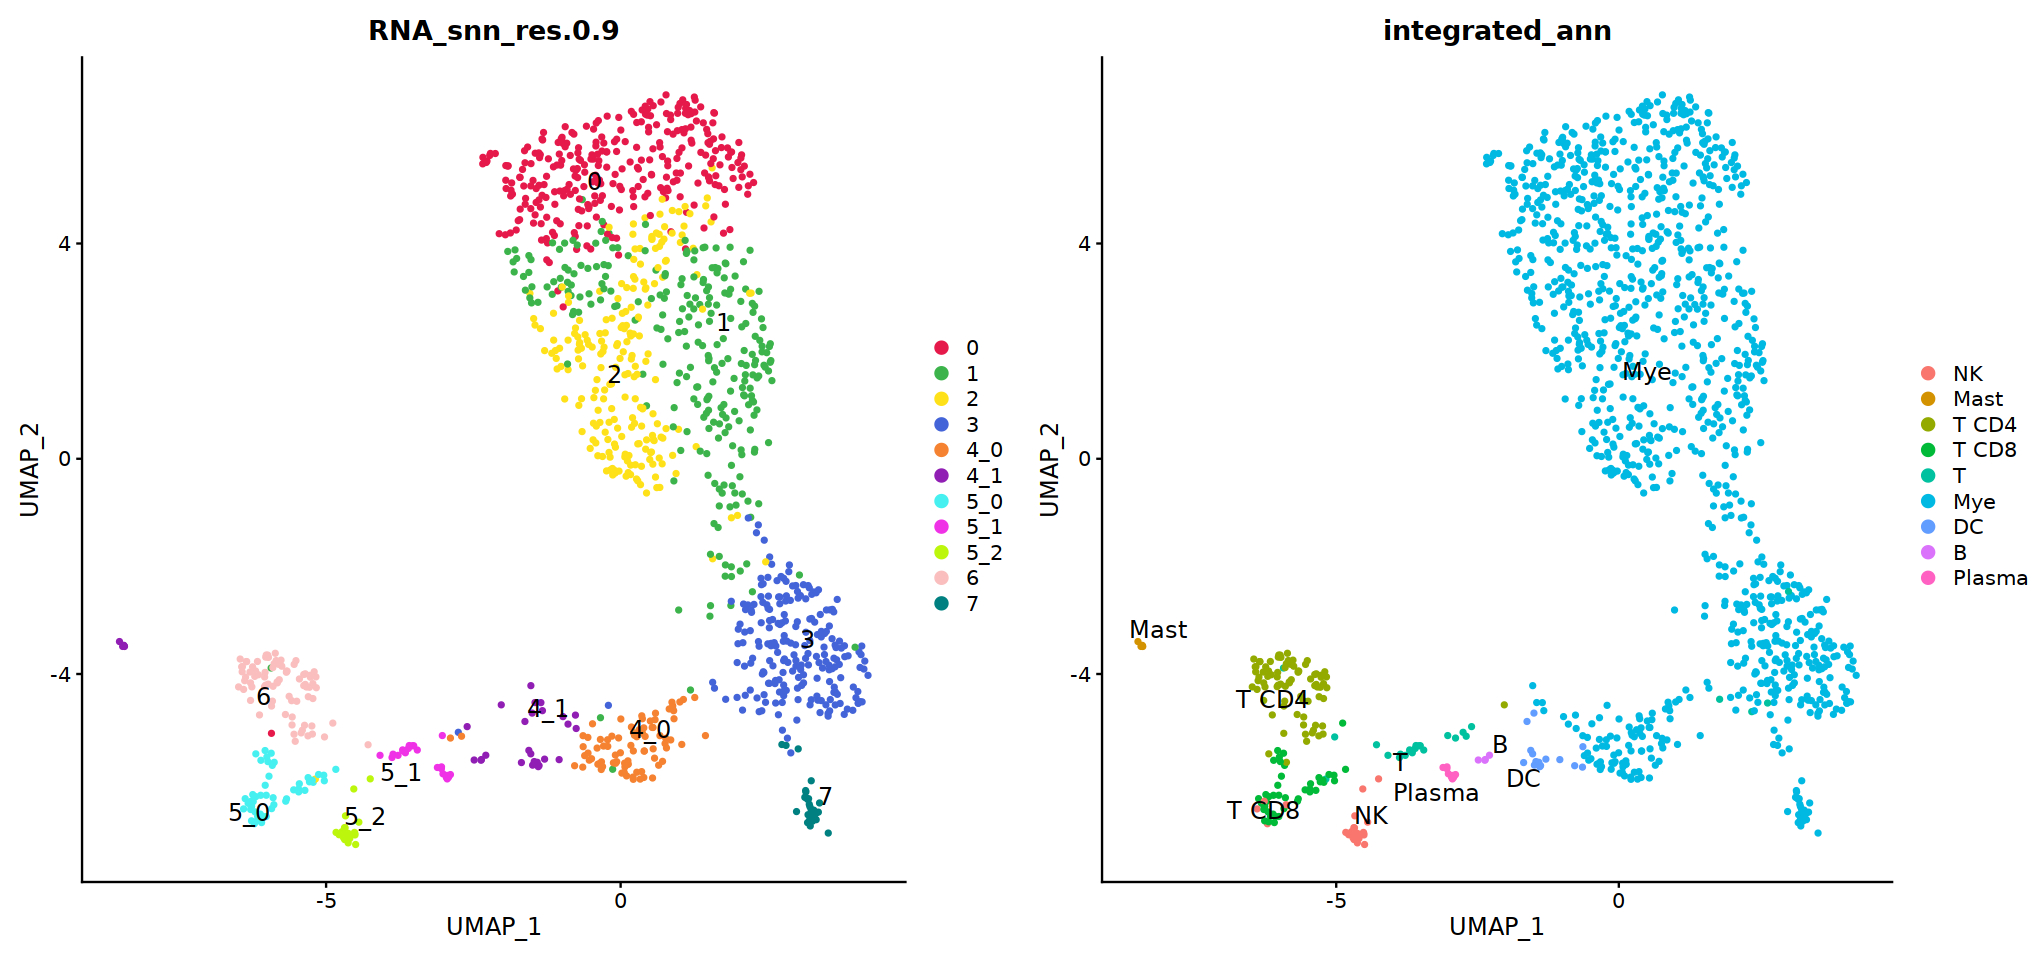
Idents(seu) <- group.by
deg = FindMarkers(seu,assay='RNA',slot='data',only.pos=T, ident.1='5_1')
deg
| p_val | avg_log2FC | pct.1 | pct.2 | p_val_adj | |
|---|---|---|---|---|---|
| <dbl> | <dbl> | <dbl> | <dbl> | <dbl> | |
| SKA1 | 4.529413e-184 | 1.0616795 | 0.68 | 0.001 | 1.083254e-179 |
| CDCA2 | 2.247430e-140 | 0.8081710 | 0.56 | 0.002 | 5.374953e-136 |
| ASPM | 2.347815e-135 | 0.9433470 | 0.60 | 0.003 | 5.615035e-131 |
| DEPDC1B | 3.030864e-135 | 0.9666570 | 0.60 | 0.003 | 7.248614e-131 |
| MYBL2 | 1.725129e-133 | 1.2724559 | 0.64 | 0.005 | 4.125818e-129 |
| GTSE1 | 2.940315e-128 | 1.0885697 | 0.60 | 0.004 | 7.032057e-124 |
| RRM2 | 1.173571e-116 | 1.3716502 | 0.64 | 0.007 | 2.806712e-112 |
| CENPM | 1.739824e-114 | 1.5721272 | 0.84 | 0.018 | 4.160964e-110 |
| MKI67 | 2.385092e-110 | 2.1271177 | 0.68 | 0.010 | 5.704186e-106 |
| TOP2A | 1.137415e-109 | 1.6144942 | 0.68 | 0.010 | 2.720242e-105 |
| BIRC5 | 8.019417e-103 | 1.4668163 | 0.72 | 0.014 | 1.917924e-98 |
| CKAP2L | 2.381192e-101 | 0.7510960 | 0.52 | 0.005 | 5.694859e-97 |
| AURKB | 3.183241e-96 | 0.7340059 | 0.52 | 0.005 | 7.613038e-92 |
| DLGAP5 | 1.050986e-95 | 0.7817285 | 0.40 | 0.002 | 2.513539e-91 |
| CD70 | 2.967132e-95 | 1.3376831 | 0.68 | 0.013 | 7.096193e-91 |
| FCRL5 | 5.122265e-93 | 0.7613262 | 0.36 | 0.001 | 1.225041e-88 |
| DERL3 | 1.832524e-92 | 1.6684161 | 0.44 | 0.003 | 4.382665e-88 |
| CDCA5 | 3.309408e-92 | 0.7200375 | 0.44 | 0.003 | 7.914779e-88 |
| TNFRSF17 | 4.278925e-92 | 0.5969524 | 0.32 | 0.000 | 1.023348e-87 |
| CCNA2 | 5.926273e-92 | 1.2414840 | 0.52 | 0.006 | 1.417327e-87 |
| CDC20 | 4.114442e-88 | 0.9435258 | 0.40 | 0.002 | 9.840099e-84 |
| POU2AF1 | 1.122809e-86 | 1.6789464 | 0.44 | 0.004 | 2.685310e-82 |
| FOXM1 | 1.275044e-86 | 0.6860714 | 0.48 | 0.005 | 3.049394e-82 |
| CENPA | 4.605660e-86 | 0.8960499 | 0.56 | 0.009 | 1.101490e-81 |
| IGLL5 | 1.752393e-84 | 1.4234849 | 0.36 | 0.002 | 4.191024e-80 |
| KIFC1 | 2.635741e-83 | 1.0387487 | 0.60 | 0.012 | 6.303638e-79 |
| MZB1 | 4.328649e-83 | 3.7447590 | 0.56 | 0.010 | 1.035240e-78 |
| FANCI | 1.313591e-82 | 0.9583166 | 0.60 | 0.012 | 3.141584e-78 |
| TRIP13 | 3.017287e-82 | 0.6482832 | 0.48 | 0.006 | 7.216144e-78 |
| KIF11 | 3.660979e-82 | 0.7168249 | 0.48 | 0.006 | 8.755598e-78 |
| ⋮ | ⋮ | ⋮ | ⋮ | ⋮ | ⋮ |
| NSL1 | 0.1017348 | 0.4448458 | 0.32 | 0.195 | 1 |
| COA5 | 0.1044847 | 0.2509637 | 0.32 | 0.188 | 1 |
| ARMCX6 | 0.1087574 | 0.3024135 | 0.36 | 0.217 | 1 |
| PCBP2 | 0.1131869 | 0.3774938 | 0.76 | 0.611 | 1 |
| SF3A3 | 0.1158752 | 0.2682449 | 0.32 | 0.213 | 1 |
| VPS29 | 0.1163471 | 0.2549449 | 0.76 | 0.544 | 1 |
| BRD7 | 0.1361030 | 0.2579446 | 0.36 | 0.237 | 1 |
| ARF4 | 0.1465265 | 0.2966868 | 0.56 | 0.457 | 1 |
| ILK | 0.1479235 | 0.2535775 | 0.56 | 0.443 | 1 |
| SERP1 | 0.1482560 | 0.4206583 | 0.88 | 0.854 | 1 |
| C19orf47 | 0.1631718 | 0.4059387 | 0.12 | 0.055 | 1 |
| SEC61G | 0.1695896 | 0.3326862 | 0.88 | 0.790 | 1 |
| AKIP1 | 0.1899456 | 0.2785941 | 0.24 | 0.158 | 1 |
| ACTG1 | 0.2108424 | 0.4265636 | 1.00 | 0.972 | 1 |
| UBE2J1 | 0.2130310 | 0.6421638 | 0.56 | 0.554 | 1 |
| C9orf78 | 0.2178027 | 0.2952428 | 0.40 | 0.325 | 1 |
| FKBP1A | 0.2265558 | 0.3998329 | 0.92 | 0.813 | 1 |
| OTULINL | 0.2270877 | 0.3397660 | 0.24 | 0.174 | 1 |
| ABCG1 | 0.2406336 | 0.2758877 | 0.32 | 0.223 | 1 |
| NDUFB2 | 0.2710720 | 0.3022708 | 0.92 | 0.773 | 1 |
| MTRNR2L12 | 0.2751424 | 0.3199979 | 0.96 | 0.945 | 1 |
| CFL1 | 0.2766974 | 0.2696641 | 1.00 | 0.964 | 1 |
| RPN1 | 0.3335925 | 0.2649764 | 0.76 | 0.613 | 1 |
| WDR41 | 0.3649307 | 0.3186731 | 0.24 | 0.165 | 1 |
| HSPA5 | 0.3737241 | 0.2501761 | 0.80 | 0.657 | 1 |
| PFN1 | 0.3872559 | 0.3220243 | 1.00 | 0.991 | 1 |
| COTL1 | 0.4821816 | 0.4997767 | 0.80 | 0.901 | 1 |
| GART | 0.4827816 | 0.3015476 | 0.24 | 0.193 | 1 |
| MYH9 | 0.5272870 | 0.3518594 | 0.64 | 0.610 | 1 |
| DNAAF1 | 0.5625348 | 1.9990397 | 0.12 | 0.090 | 1 |
Idents(seu) <- group.by
deg = FindMarkers(seu,assay='RNA',slot='data',only.pos=T, ident.1='5_2')
deg
| p_val | avg_log2FC | pct.1 | pct.2 | p_val_adj | |
|---|---|---|---|---|---|
| <dbl> | <dbl> | <dbl> | <dbl> | <dbl> | |
| KLRC3 | 1.323678e-147 | 2.4805900 | 0.60 | 0.002 | 3.165708e-143 |
| FGFBP2 | 1.683789e-110 | 2.7932835 | 0.50 | 0.002 | 4.026950e-106 |
| KLRD1 | 2.554944e-101 | 3.5094949 | 0.95 | 0.026 | 6.110404e-97 |
| KRT86 | 7.472939e-101 | 1.4961342 | 0.35 | 0.000 | 1.787228e-96 |
| TRDC | 2.868893e-89 | 1.7540210 | 0.45 | 0.003 | 6.861245e-85 |
| FEZ1 | 3.153624e-88 | 1.3040181 | 0.35 | 0.001 | 7.542207e-84 |
| SH2D1B | 1.186928e-86 | 1.3840762 | 0.30 | 0.000 | 2.838657e-82 |
| KIR2DL3 | 1.186928e-86 | 1.5756475 | 0.30 | 0.000 | 2.838657e-82 |
| KIR2DL1 | 1.819076e-72 | 1.4607241 | 0.25 | 0.000 | 4.350503e-68 |
| GNLY | 2.729442e-68 | 4.9684619 | 0.85 | 0.034 | 6.527733e-64 |
| GZMH | 2.672236e-64 | 2.8959603 | 0.80 | 0.031 | 6.390919e-60 |
| KLRC2 | 3.868288e-64 | 1.3814570 | 0.35 | 0.003 | 9.251397e-60 |
| FCRL3 | 2.707115e-58 | 0.8330499 | 0.20 | 0.000 | 6.474336e-54 |
| GZMB | 1.138927e-51 | 3.9273659 | 0.90 | 0.053 | 2.723858e-47 |
| PRF1 | 1.117044e-48 | 3.8853674 | 0.90 | 0.061 | 2.671523e-44 |
| KLRF1 | 3.005528e-47 | 1.7223702 | 0.35 | 0.006 | 7.188020e-43 |
| KRT81 | 3.957962e-44 | 1.0513876 | 0.15 | 0.000 | 9.465862e-40 |
| TRBC1 | 5.527776e-44 | 2.8782348 | 0.70 | 0.039 | 1.322023e-39 |
| CCL5 | 1.630512e-41 | 4.3033639 | 1.00 | 0.100 | 3.899532e-37 |
| PPP2R2B | 3.312914e-41 | 1.0979193 | 0.35 | 0.008 | 7.923165e-37 |
| AKAP5 | 2.501702e-40 | 1.0892602 | 0.25 | 0.003 | 5.983070e-36 |
| CD247 | 2.514634e-39 | 2.9526125 | 0.85 | 0.070 | 6.014000e-35 |
| CST7 | 6.412558e-39 | 3.6775650 | 1.00 | 0.110 | 1.533627e-34 |
| CTSW | 8.077229e-37 | 2.8210865 | 0.70 | 0.049 | 1.931750e-32 |
| IL2RB | 6.076622e-36 | 2.3720474 | 0.70 | 0.050 | 1.453285e-31 |
| NKG7 | 5.555415e-35 | 4.8861787 | 1.00 | 0.135 | 1.328633e-30 |
| TGFBR3 | 1.308066e-30 | 1.1925279 | 0.30 | 0.009 | 3.128371e-26 |
| HOPX | 4.428423e-30 | 3.0221605 | 0.65 | 0.053 | 1.059102e-25 |
| NR5A2 | 5.834930e-30 | 0.3599126 | 0.10 | 0.000 | 1.395482e-25 |
| LINC00092 | 5.834930e-30 | 0.6037743 | 0.10 | 0.000 | 1.395482e-25 |
| ⋮ | ⋮ | ⋮ | ⋮ | ⋮ | ⋮ |
| SMAD2 | 0.9852088 | 0.3850612 | 0.20 | 0.244 | 1 |
| EIF4B | 0.9863712 | 0.5297803 | 0.30 | 0.377 | 1 |
| WDFY1 | 0.9880298 | 0.3554380 | 0.25 | 0.302 | 1 |
| NPIPB4 | 0.9881636 | 0.4350971 | 0.10 | 0.109 | 1 |
| TPST2 | 0.9891792 | 0.3107000 | 0.25 | 0.301 | 1 |
| FAM133B | 0.9905682 | 0.3959952 | 0.25 | 0.294 | 1 |
| POLG | 0.9906453 | 0.2969353 | 0.15 | 0.173 | 1 |
| CIC | 0.9908781 | 0.5019340 | 0.10 | 0.111 | 1 |
| PURA | 0.9917468 | 0.2705633 | 0.10 | 0.111 | 1 |
| HDDC2 | 0.9920558 | 0.3247593 | 0.15 | 0.172 | 1 |
| MBTPS1 | 0.9926155 | 0.3409611 | 0.10 | 0.111 | 1 |
| ARMC10 | 0.9945864 | 0.3681205 | 0.20 | 0.237 | 1 |
| STAT5B | 0.9952072 | 0.3324232 | 0.10 | 0.111 | 1 |
| SIRT7 | 0.9953141 | 0.4908146 | 0.15 | 0.172 | 1 |
| C14orf119 | 0.9956316 | 0.2806037 | 0.25 | 0.305 | 1 |
| COPS8 | 0.9956347 | 0.2774843 | 0.15 | 0.169 | 1 |
| SNHG12 | 0.9963889 | 0.3040291 | 0.15 | 0.172 | 1 |
| CIAPIN1 | 0.9969500 | 0.4366913 | 0.10 | 0.111 | 1 |
| NBPF26 | 0.9978215 | 0.3443716 | 0.10 | 0.111 | 1 |
| CDC26 | 0.9980919 | 0.2800444 | 0.30 | 0.377 | 1 |
| RSRC2 | 0.9981165 | 0.5558611 | 0.30 | 0.394 | 1 |
| COPS7B | 0.9986889 | 0.2556948 | 0.10 | 0.110 | 1 |
| PGRMC2 | 0.9986889 | 0.3174646 | 0.10 | 0.110 | 1 |
| CDK5 | 0.9986929 | 0.3552061 | 0.10 | 0.111 | 1 |
| EWSR1 | 0.9990223 | 0.4095853 | 0.45 | 0.613 | 1 |
| PPP2R5E | 0.9990291 | 0.2655992 | 0.20 | 0.227 | 1 |
| GPBP1L1 | 0.9996845 | 0.4996124 | 0.20 | 0.243 | 1 |
| GUSB | 1.0000000 | 0.3265122 | 0.35 | 0.451 | 1 |
| PHB2 | 1.0000000 | 0.5302282 | 0.30 | 0.390 | 1 |
| AMZ2 | 1.0000000 | 0.3104069 | 0.20 | 0.234 | 1 |
# adopt integrated_ann first
seu@meta.data[, "persample_ann"] = as.character(seu@meta.data[, "integrated_ann"] )
o(6,6)
FeaturePlot(seu, features = 'CD19')
FeaturePlot(seu, features = 'CD79A')
FeaturePlot(seu, features = 'JCHAIN')
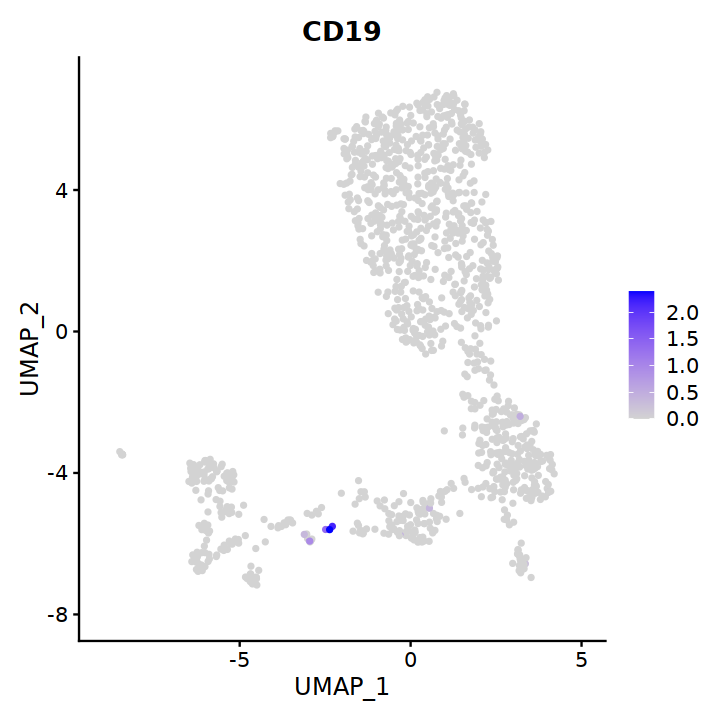
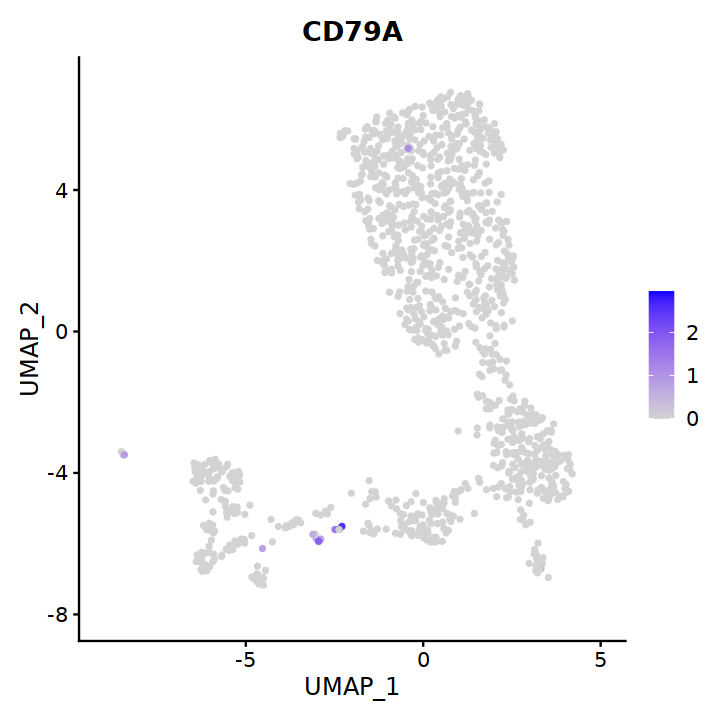

o(10,5)
FeaturePlot(seu, pt.size=0.1, features = c('CXCR2','FCGR3B'))
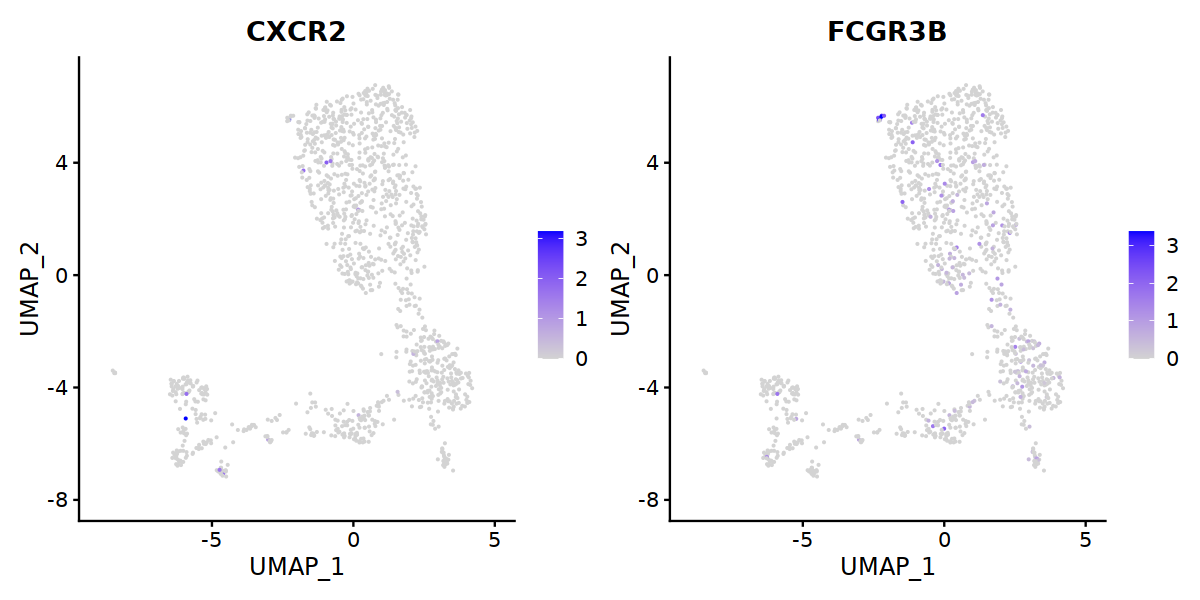
DC
# pDC
p=Nebulosa::plot_density(seu,c('IRF4','LILRA4','LILRB4','IRF8'),joint=T)&theme(
    axis.title=element_blank(),axis.ticks=element_blank(),axis.text = element_blank())&NoLegend()
o(5*6, 5*1)
p+plot_layout(ncol = 6)

# cDC1
p=Nebulosa::plot_density(seu,c('HLA-DQA1','BATF3','CADM1','CLEC9A','XCR1'),joint=T)&theme(
    axis.title=element_blank(),axis.ticks=element_blank(),axis.text = element_blank())&NoLegend()
o(5*6, 5*1)
p+plot_layout(ncol = 6)


# cDC2
p=Nebulosa::plot_density(seu,c('CD14','PLD4','CD1C','CX3CR1','CLEC10A'),joint=T)&theme(
    axis.title=element_blank(),axis.ticks=element_blank(),axis.text = element_blank())&NoLegend()
o(5*6, 5*1)
p+plot_layout(ncol = 6)


# DC markers
o(5*5, 5*4)
FeaturePlot(seu, ncol = 5,pt.size=0.01,
            features = c('CST3','FCER1A','ITGAX',# pan DC
                         'LAMP3','CLEC9A',#cDC1
                         "CD1C",'HLA-DQA1',"PLD4",# cDC2
                         'LILRA4','LILRB4','IRF8','CCR7', #pDC
                         'CCL17','CD163','CD14','FCER1A','CD1A','MRC1'#moDC
                        )
           )&theme(
legend.position=c(0.8,0.8),
axis.line = element_blank(),
axis.title = element_blank(),axis.text = element_blank(), axis.ticks=element_blank()
)
Warning message in FeaturePlot(seu, ncol = 5, pt.size = 0.01, features = c("CST3", :
“All cells have the same value (0) of FCER1A.”
Warning message in FeaturePlot(seu, ncol = 5, pt.size = 0.01, features = c("CST3", :
“All cells have the same value (0) of FCER1A.”
Warning message in FeaturePlot(seu, ncol = 5, pt.size = 0.01, features = c("CST3", :
“All cells have the same value (0) of CD1A.”
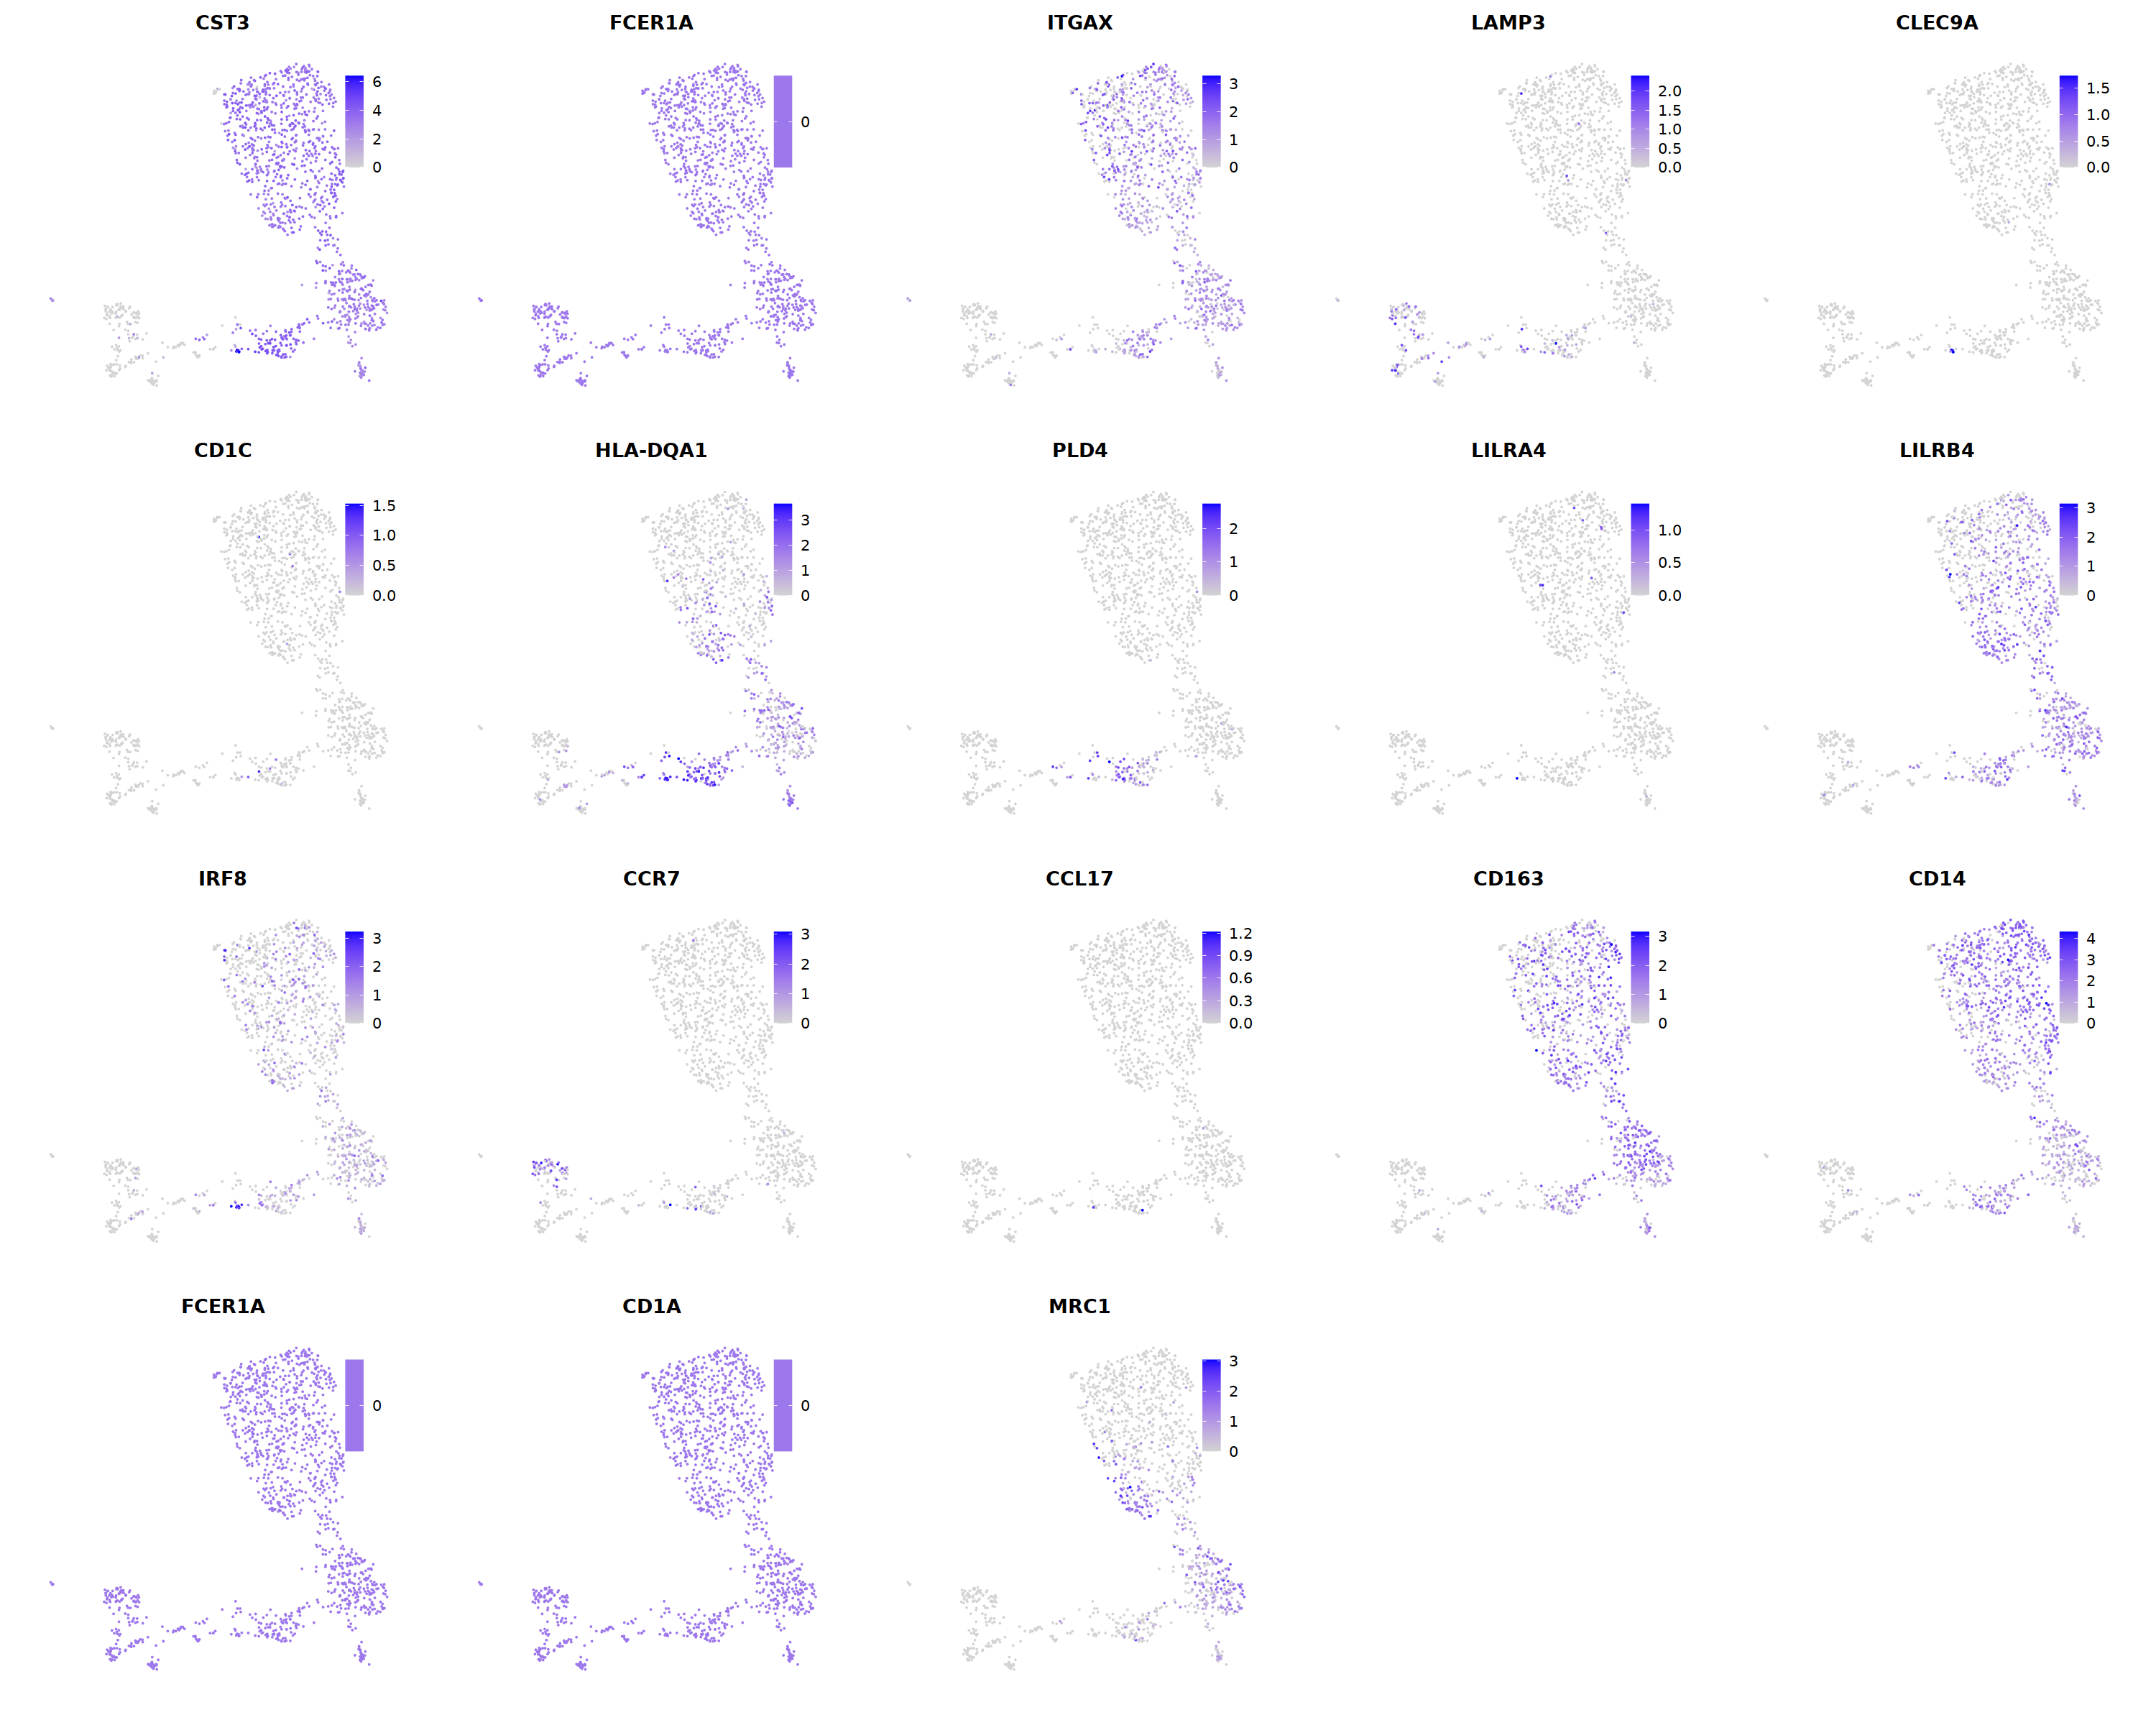
cell.sel = Cells(subset(seu, RNA_snn_res.0.9=='4'))
seu@meta.data[cell.sel, "persample_ann"] = 'DC'
Mac
# macrophages
o(5*5, 5*9)
FeaturePlot(seu, ncol = 5, pt.size=0.01,
features = c("CD14",'LYZ',"FCGR3A",
'OLR1','CDKN1C','LILRB2',"ITGAL",
'CDKN1C','LILRB2','ITGAL',
'S100A12','PROK2','S100A8','VCAN',
'NT5E','ANGPTL4','CXCL5','BAG3',
'DNASE2',
'MMP7','TIMP3','CHI3L1','FABP5',
'CHIT1','GDF15','CTSK',
'CCL18','PLTP','CD209','F13A1',
'FABP4','RBP4','PPARG','MARCO',
'CXCL12','IGSF21','C3',
'CXCL9','CXCL10','CXCL11','GBP1',
'CCL17',"CLEC10A",
"TOP2A","MKI67",'CDK1')
)&theme(
legend.position=c(0.8,0.8),
axis.line = element_blank(),
axis.title = element_blank(),axis.text = element_blank(), axis.ticks=element_blank()
)
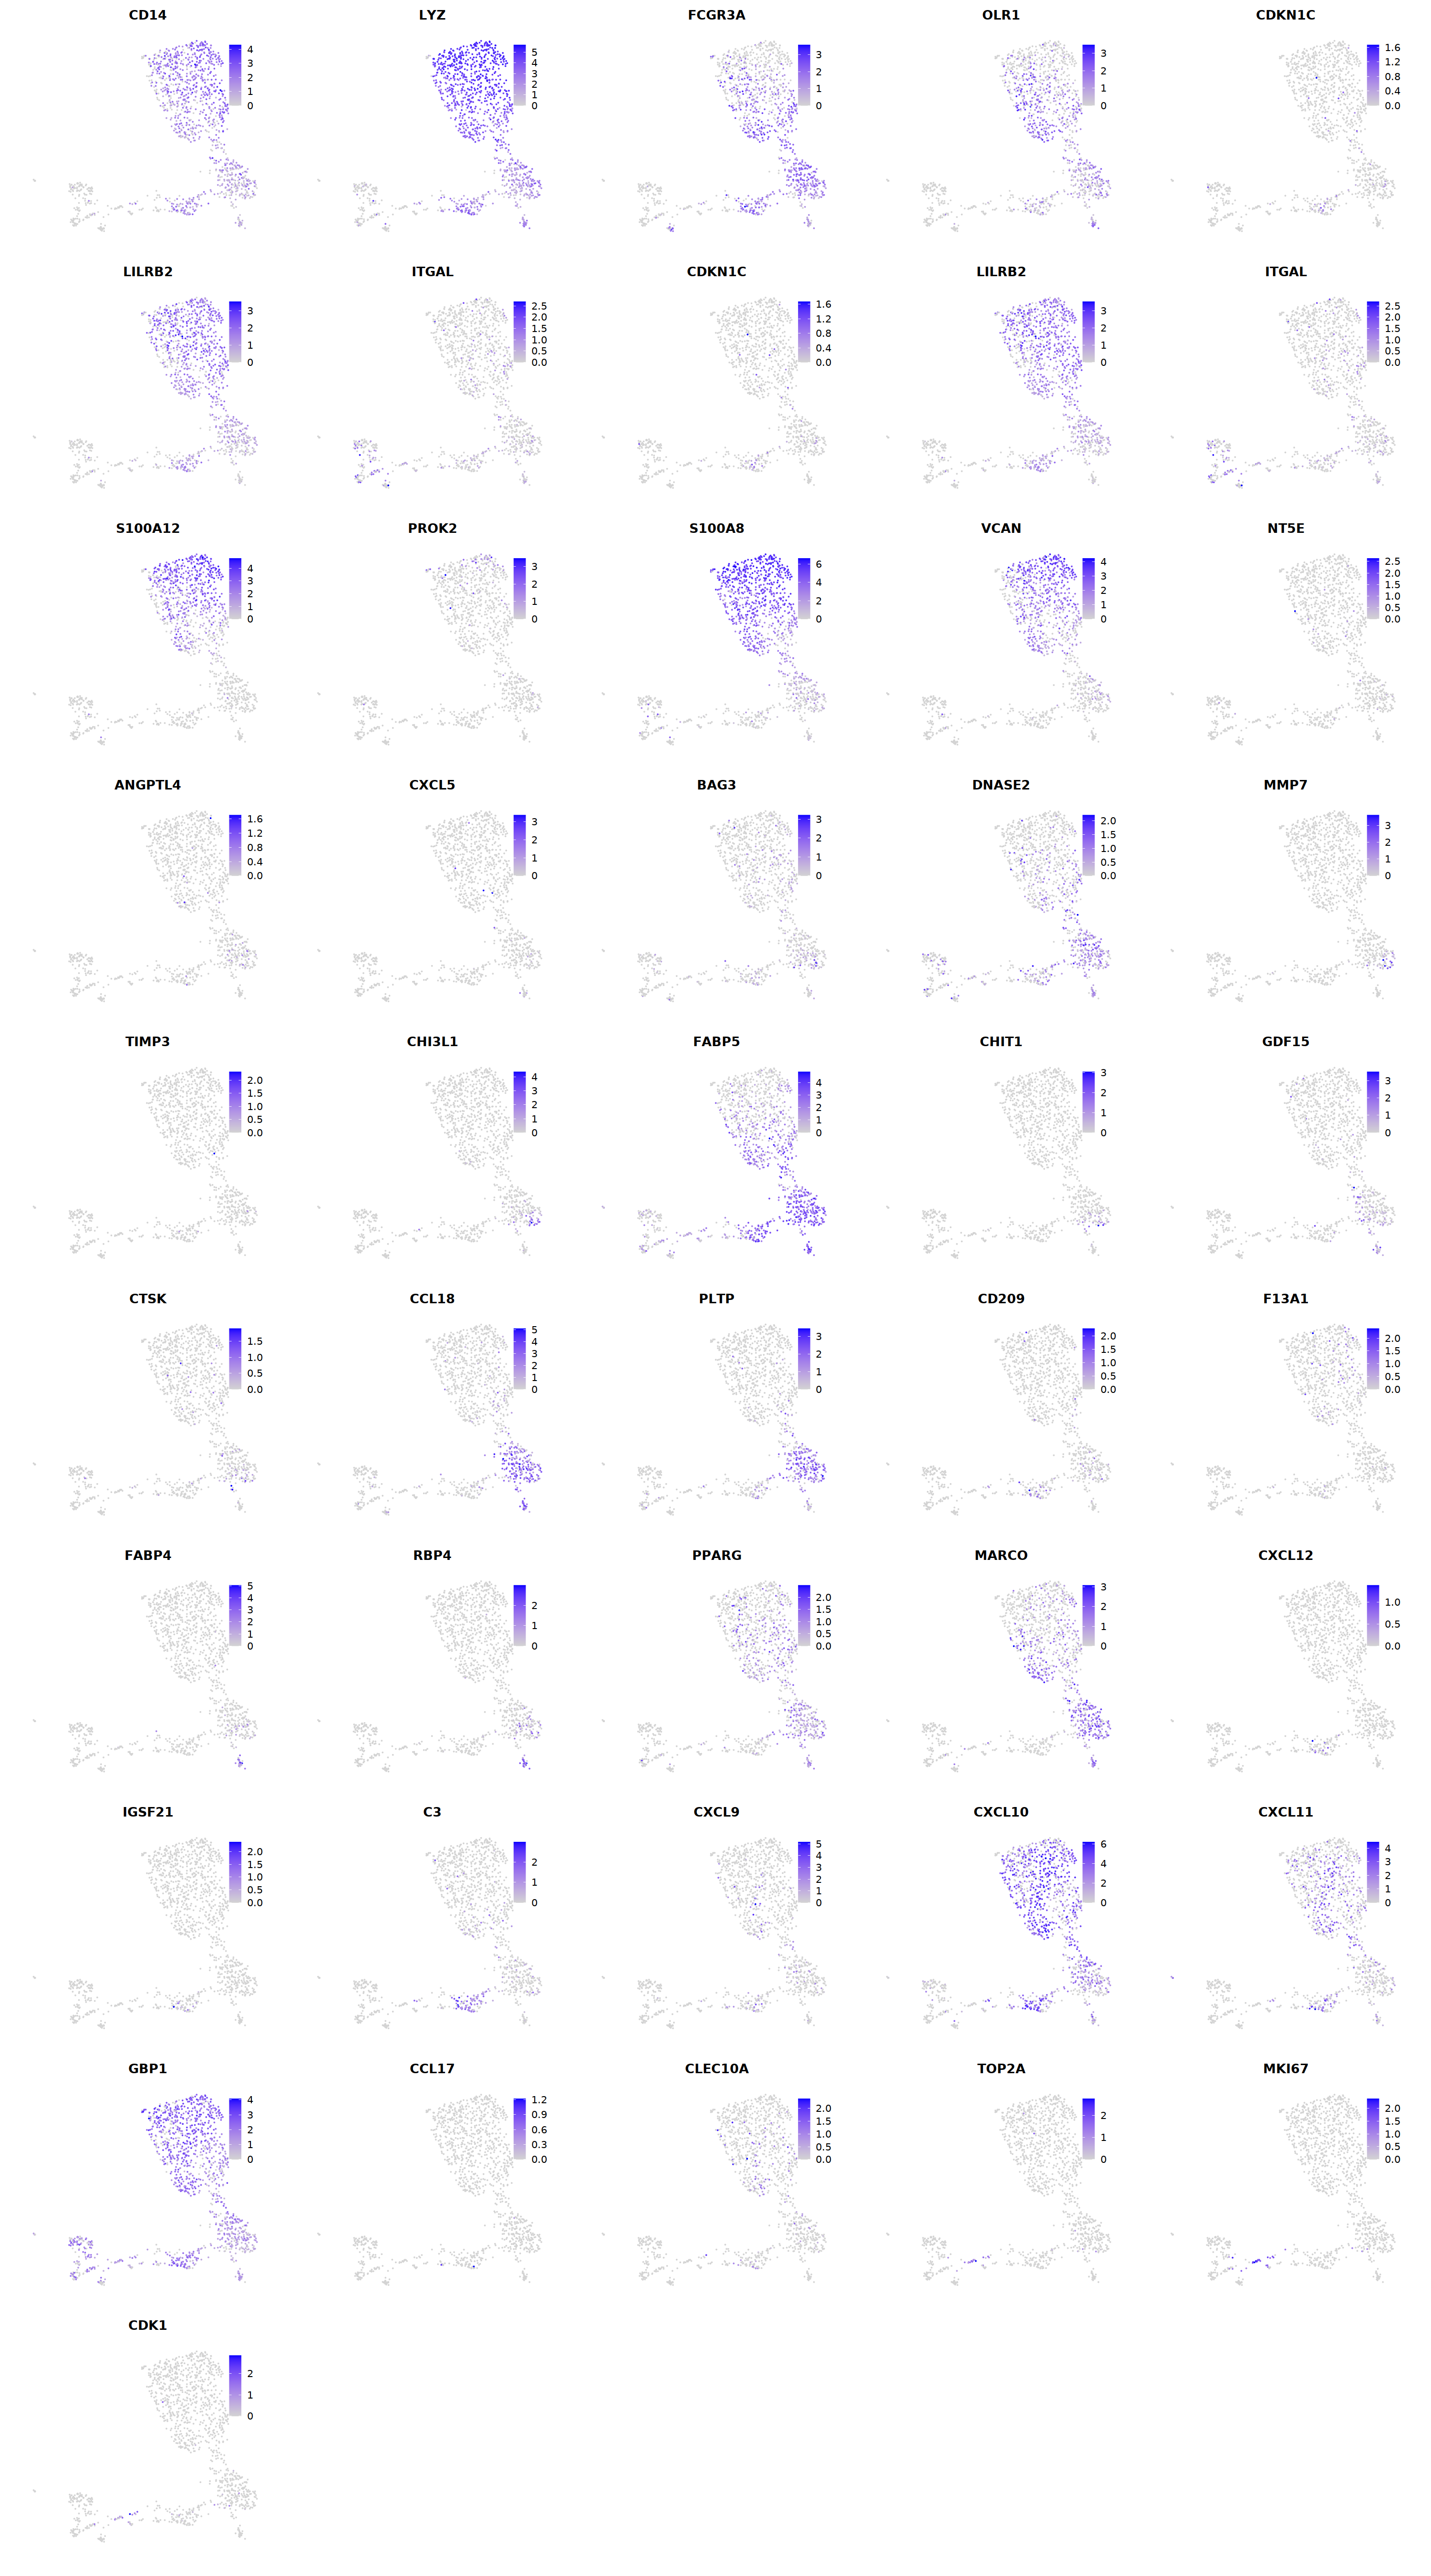
cell.sel = Cells(subset(seu, RNA_snn_res.0.9=='0'))
seu@meta.data[cell.sel, "persample_ann"] = 'macrophage'
cell.sel = Cells(subset(seu, RNA_snn_res.0.9=='1'))
seu@meta.data[cell.sel, "persample_ann"] = 'macrophage'
cell.sel = Cells(subset(seu, RNA_snn_res.0.9=='2'))
seu@meta.data[cell.sel, "persample_ann"] = 'macrophage'
cell.sel = Cells(subset(seu, RNA_snn_res.0.9=='3'))
seu@meta.data[cell.sel, "persample_ann"] = 'macrophage'
cell.sel = Cells(subset(seu, RNA_snn_res.0.9=='7'))
seu@meta.data[cell.sel, "persample_ann"] = 'macrophage'
T
# T cell markers
o(5*5, 5*7)
FeaturePlot(seu, ncol = 5,pt.size=0.01,
features = c("CD3D","CD3E",'TRAC','TRBC1','TRGC2',
'TRGC1','TRDC',"CD4",'CD8A','CD8B',
'RORC','FOXP3','CD28','IL2RA',"CD44",
'CD69','CD27','PRF1','GZMK','ID2',
'RORC','GATA3','ZBTB16','IL7R','TBX21',
'NKG7','GNLY','EOMES','KLRB1','TOX',
"TOX2",'CXCR5','SELL','CD68','MT2A',
'CST7','HOPX','GZMM','KLRD1','KLRC2',
'KLRF1'), order=F)&theme(axis.line = element_blank(),
axis.title = element_blank(),axis.text = element_blank(), axis.ticks=element_blank()
)
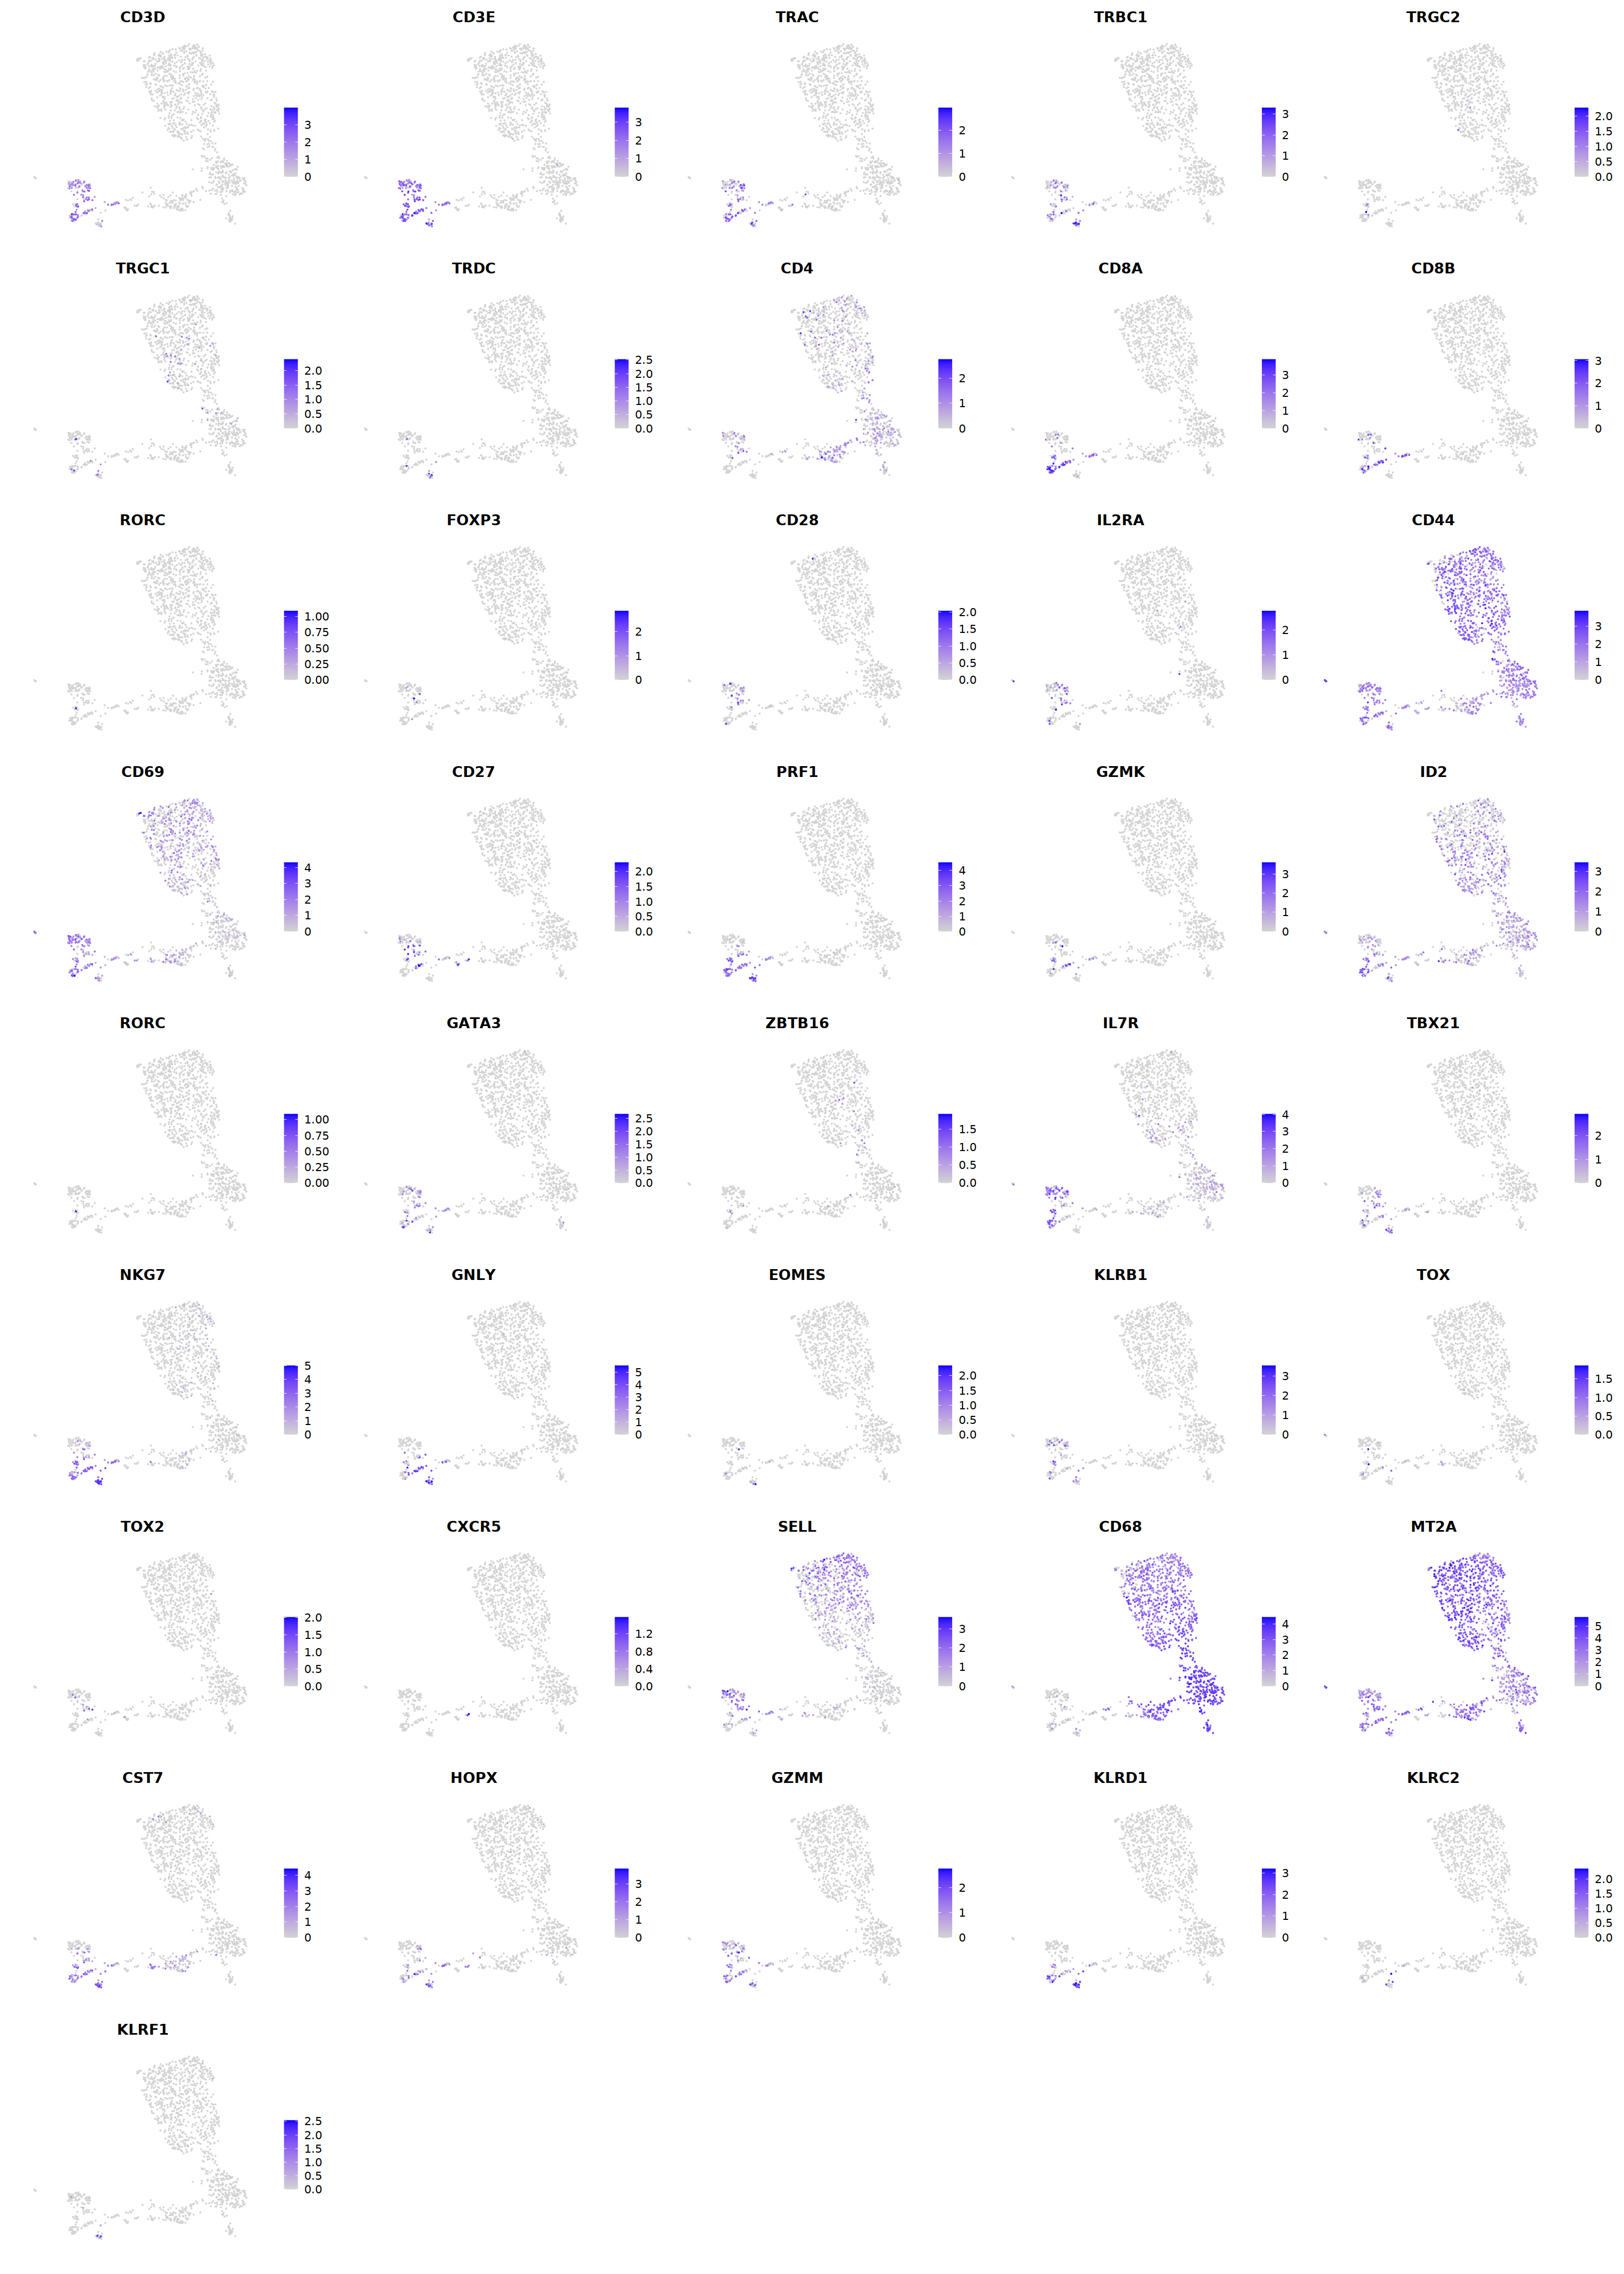
cell.sel = Cells(subset(seu, RNA_snn_res.0.9=='5_2'))
seu@meta.data[cell.sel, "persample_ann"] = 'NKT'
cell.sel = Cells(subset(seu, RNA_snn_res.0.9=='5_1'))
seu@meta.data[cell.sel, "persample_ann"] = 'T cycling'
cell.sel = Cells(subset(seu, RNA_snn_res.0.9=='6'))
seu@meta.data[cell.sel, "persample_ann"] = 'T CD4'
cell.sel = Cells(subset(seu, RNA_snn_res.0.9=='5_0'))
seu@meta.data[cell.sel, "persample_ann"] = 'T CD8'
cell.sel = Cells(subset(seu, integrated_ann=='Mast'))
seu@meta.data[cell.sel, "persample_ann"] = 'Mast'
o(8,7);DimPlot(seu, group.by='persample_ann', label=T, repel=T, pt.size=0.1)
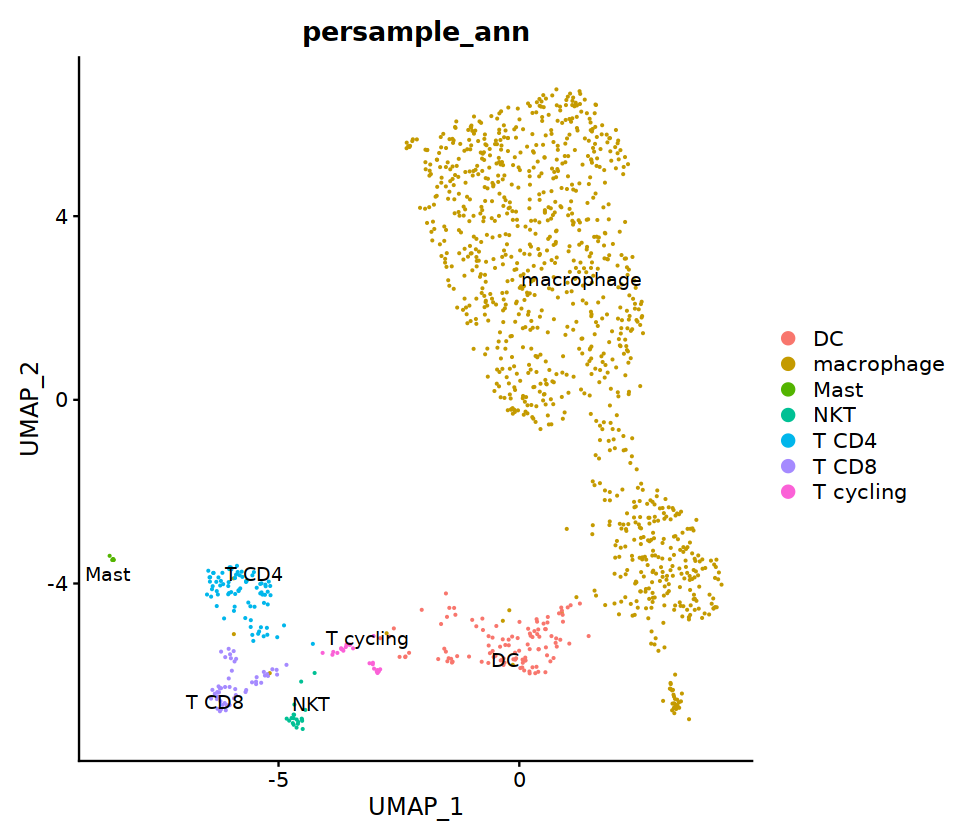
sample_name
seu -> immune.list[[sample_name]]
S5
# context switching
sample_name='S5'
seu= immune.list[[sample_name]]
group.by= 'RNA_snn_res.0.9'
Idents(seu)<-group.by
seu = FindSubCluster(seu, cluster='4',
graph.name="RNA_snn",
subcluster.name = "RNA_snn_res.0.9", resolution = 0.5, algorithm = 1)
Idents(seu)<-group.by
seu = FindSubCluster(seu, cluster='7',
graph.name="RNA_snn",
subcluster.name = "RNA_snn_res.0.9", resolution = 0.7, algorithm = 1)
Idents(seu)<-group.by
seu = FindSubCluster(seu, cluster='6',
graph.name="RNA_snn",
subcluster.name = "RNA_snn_res.0.9", resolution = 0.9, algorithm = 1)
o(17,8)
ggarrange(
DimPlot(seu, group.by=group.by, label=T,repel=T, label.size = 5, cols=manymanycolors),
DimPlot(seu, group.by='integrated_ann', label=T,repel=T, label.size = 5),
nrow=1, ncol=2
)
Modularity Optimizer version 1.3.0 by Ludo Waltman and Nees Jan van Eck
Number of nodes: 196
Number of edges: 5303
Running Louvain algorithm...
Maximum modularity in 10 random starts: 0.6935
Number of communities: 3
Elapsed time: 0 seconds
Modularity Optimizer version 1.3.0 by Ludo Waltman and Nees Jan van Eck
Number of nodes: 71
Number of edges: 985
Running Louvain algorithm...
Maximum modularity in 10 random starts: 0.5600
Number of communities: 3
Elapsed time: 0 seconds
Modularity Optimizer version 1.3.0 by Ludo Waltman and Nees Jan van Eck
Number of nodes: 94
Number of edges: 2292
Running Louvain algorithm...
Maximum modularity in 10 random starts: 0.4148
Number of communities: 3
Elapsed time: 0 seconds
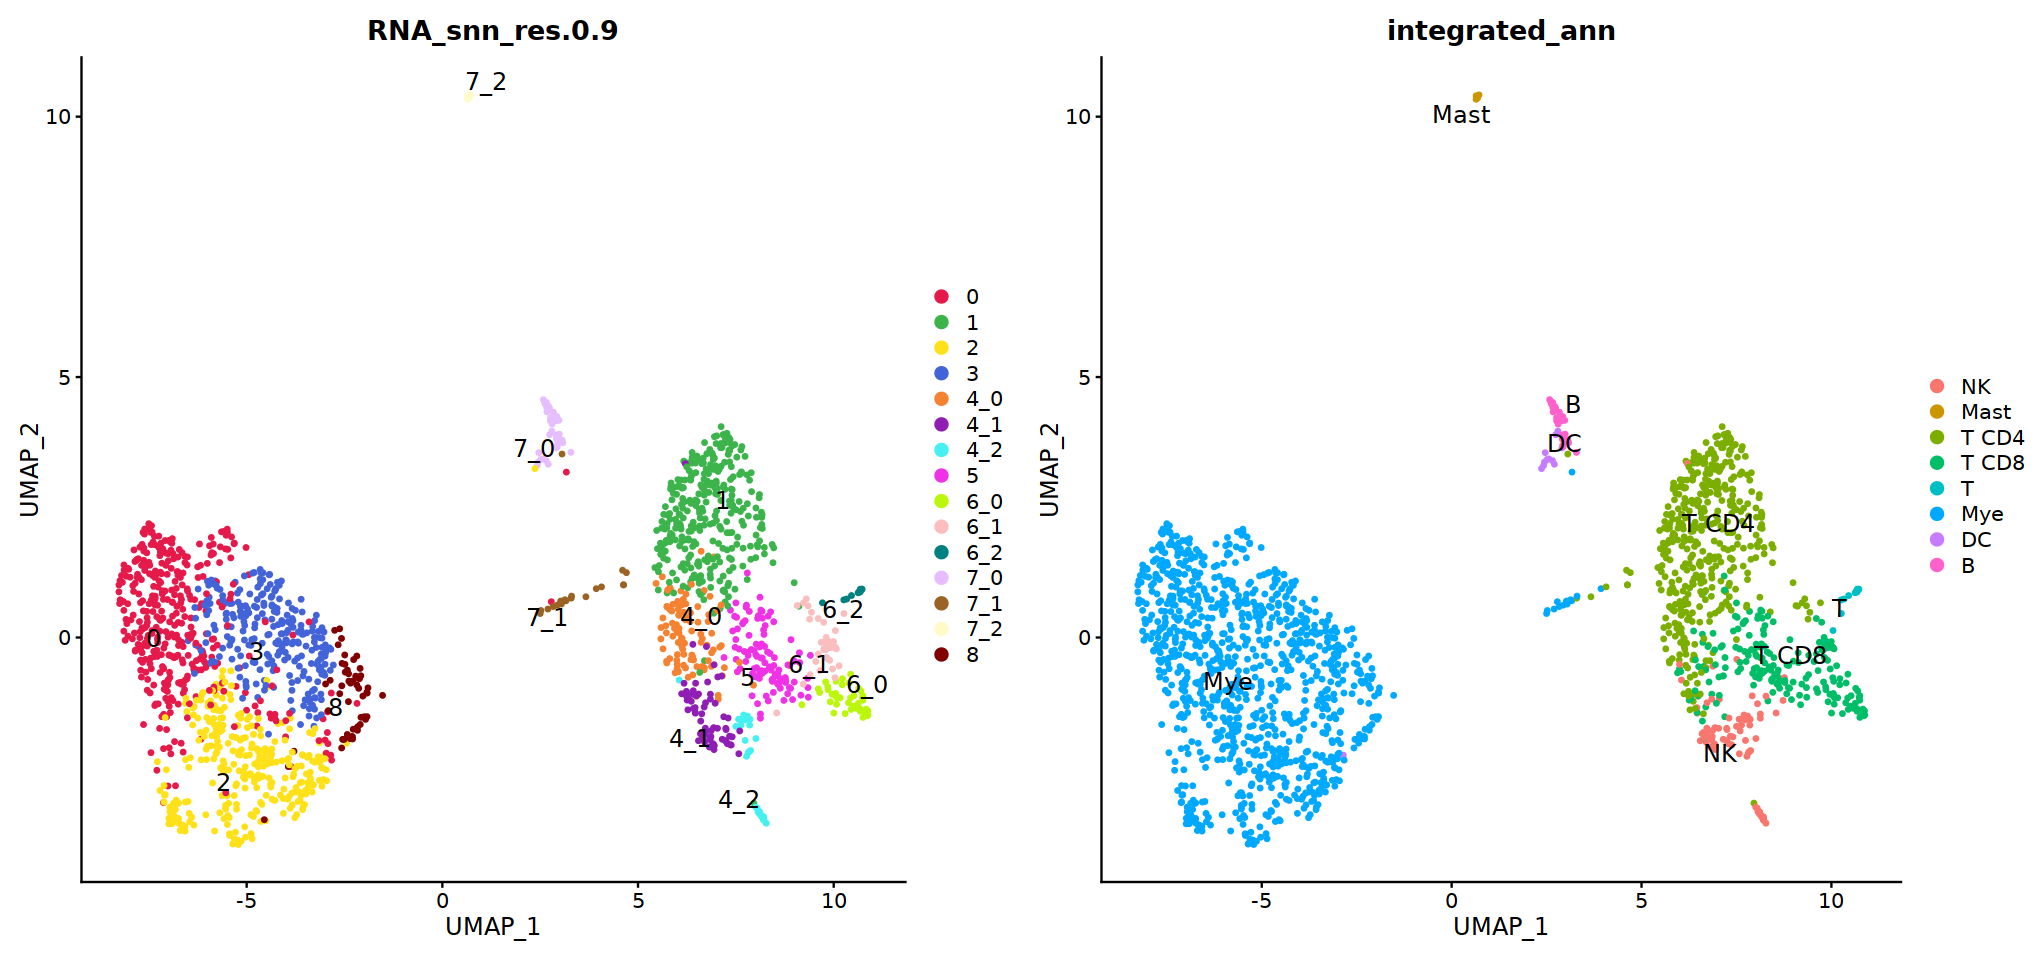
# adopt integrated_ann first
seu@meta.data[, "persample_ann"] = as.character(seu@meta.data[, "integrated_ann"] )
DC
# pDC
p=Nebulosa::plot_density(seu,c('IRF4','LILRA4','LILRB4','IRF8'),joint=T)&theme(
axis.title=element_blank(),axis.ticks=element_blank(),axis.text = element_blank())&NoLegend()
o(5*6, 5*1)
p+plot_layout(ncol = 6)
# cDC1
p=Nebulosa::plot_density(seu,c('HLA-DQA1','BATF3','CADM1','CLEC9A','XCR1'),joint=T)&theme(
axis.title=element_blank(),axis.ticks=element_blank(),axis.text = element_blank())&NoLegend()
o(5*6, 5*1)
p+plot_layout(ncol = 6)
# cDC2
p=Nebulosa::plot_density(seu,c('CD14','PLD4','CD1C','CX3CR1','CLEC10A'),joint=T)&theme(
axis.title=element_blank(),axis.ticks=element_blank(),axis.text = element_blank())&NoLegend()
o(5*6, 5*1)
p+plot_layout(ncol = 6)


FeaturePlot(seu, features = 'FCGR3B')
FeaturePlot(seu, features = 'S100A9')
FeaturePlot(seu, features = 'CXCR2')
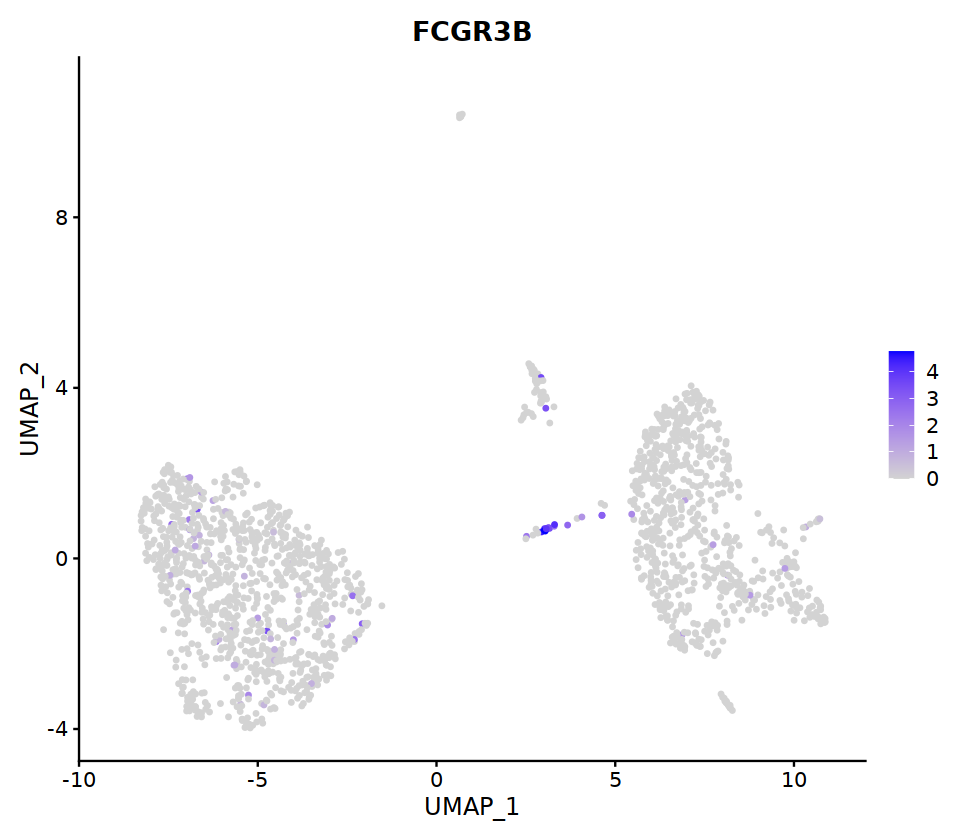
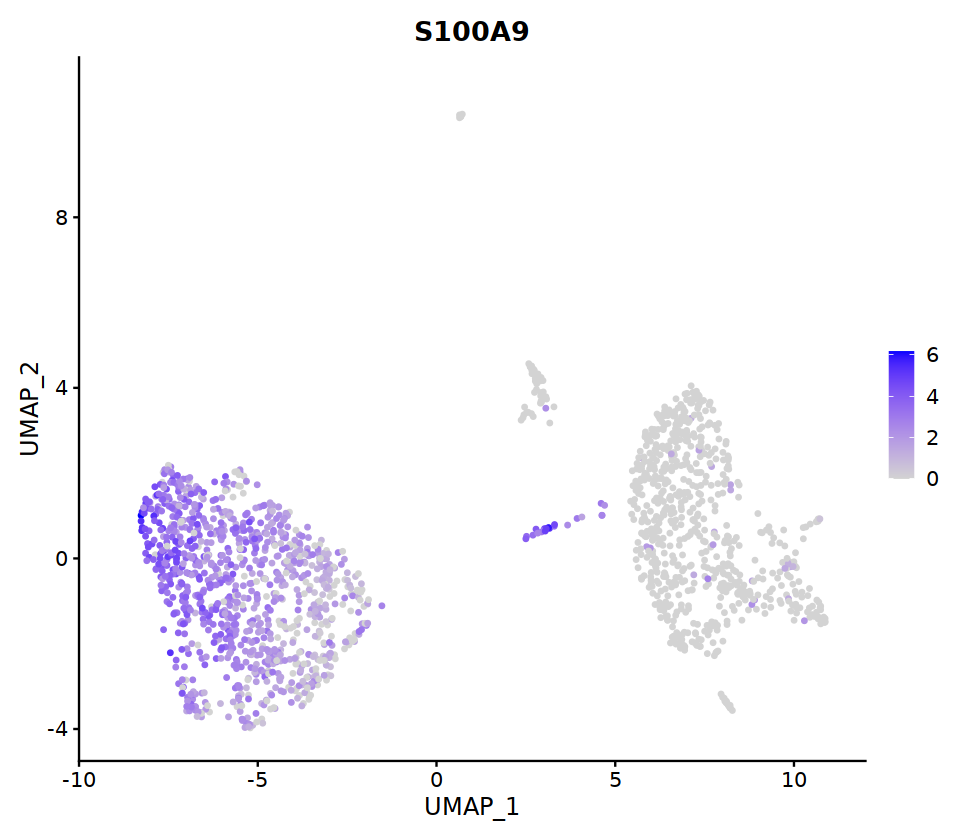
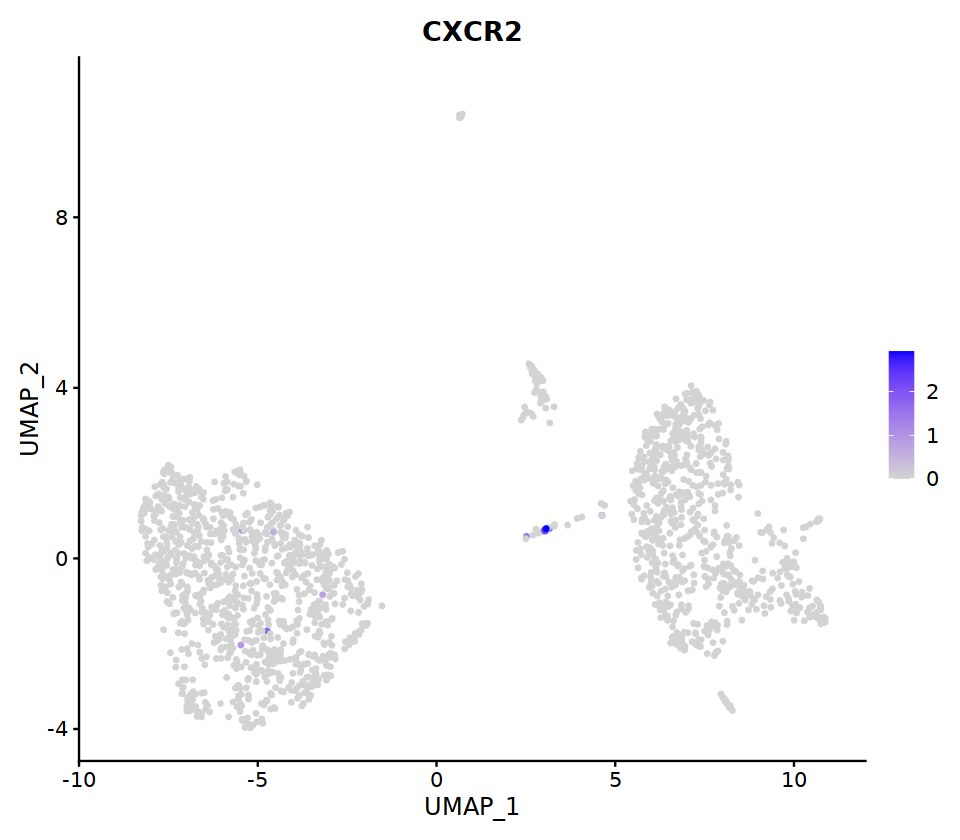
cell.sel = Cells(subset(seu, RNA_snn_res.0.9=='7_1'))
seu@meta.data[cell.sel, "persample_ann"] = 'Neu'
Mac
# macrophages
o(5*5, 5*9)
FeaturePlot(seu, ncol = 5, pt.size=0.01,
features = c("CD14",'LYZ',"FCGR3A",
'OLR1','CDKN1C','LILRB2',"ITGAL",
'CDKN1C','LILRB2','ITGAL',
'S100A12','PROK2','S100A8','VCAN',
'NT5E','ANGPTL4','CXCL5','BAG3',
'DNASE2',
'MMP7','TIMP3','CHI3L1','FABP5',
'CHIT1','GDF15','CTSK',
'CCL18','PLTP','CD209','F13A1',
'FABP4','RBP4','PPARG','MARCO',
'CXCL12','IGSF21','C3',
'CXCL9','CXCL10','CXCL11','GBP1',
'CCL17',"CLEC10A",
"TOP2A","MKI67",'CDK1')
)&theme(
legend.position=c(0.8,0.8),
axis.line = element_blank(),
axis.title = element_blank(),axis.text = element_blank(), axis.ticks=element_blank()
)
Warning message in FeaturePlot(seu, ncol = 5, pt.size = 0.01, features = c("CD14", :
“All cells have the same value (0) of CHIT1.”
Warning message in FeaturePlot(seu, ncol = 5, pt.size = 0.01, features = c("CD14", :
“All cells have the same value (0) of IGSF21.”
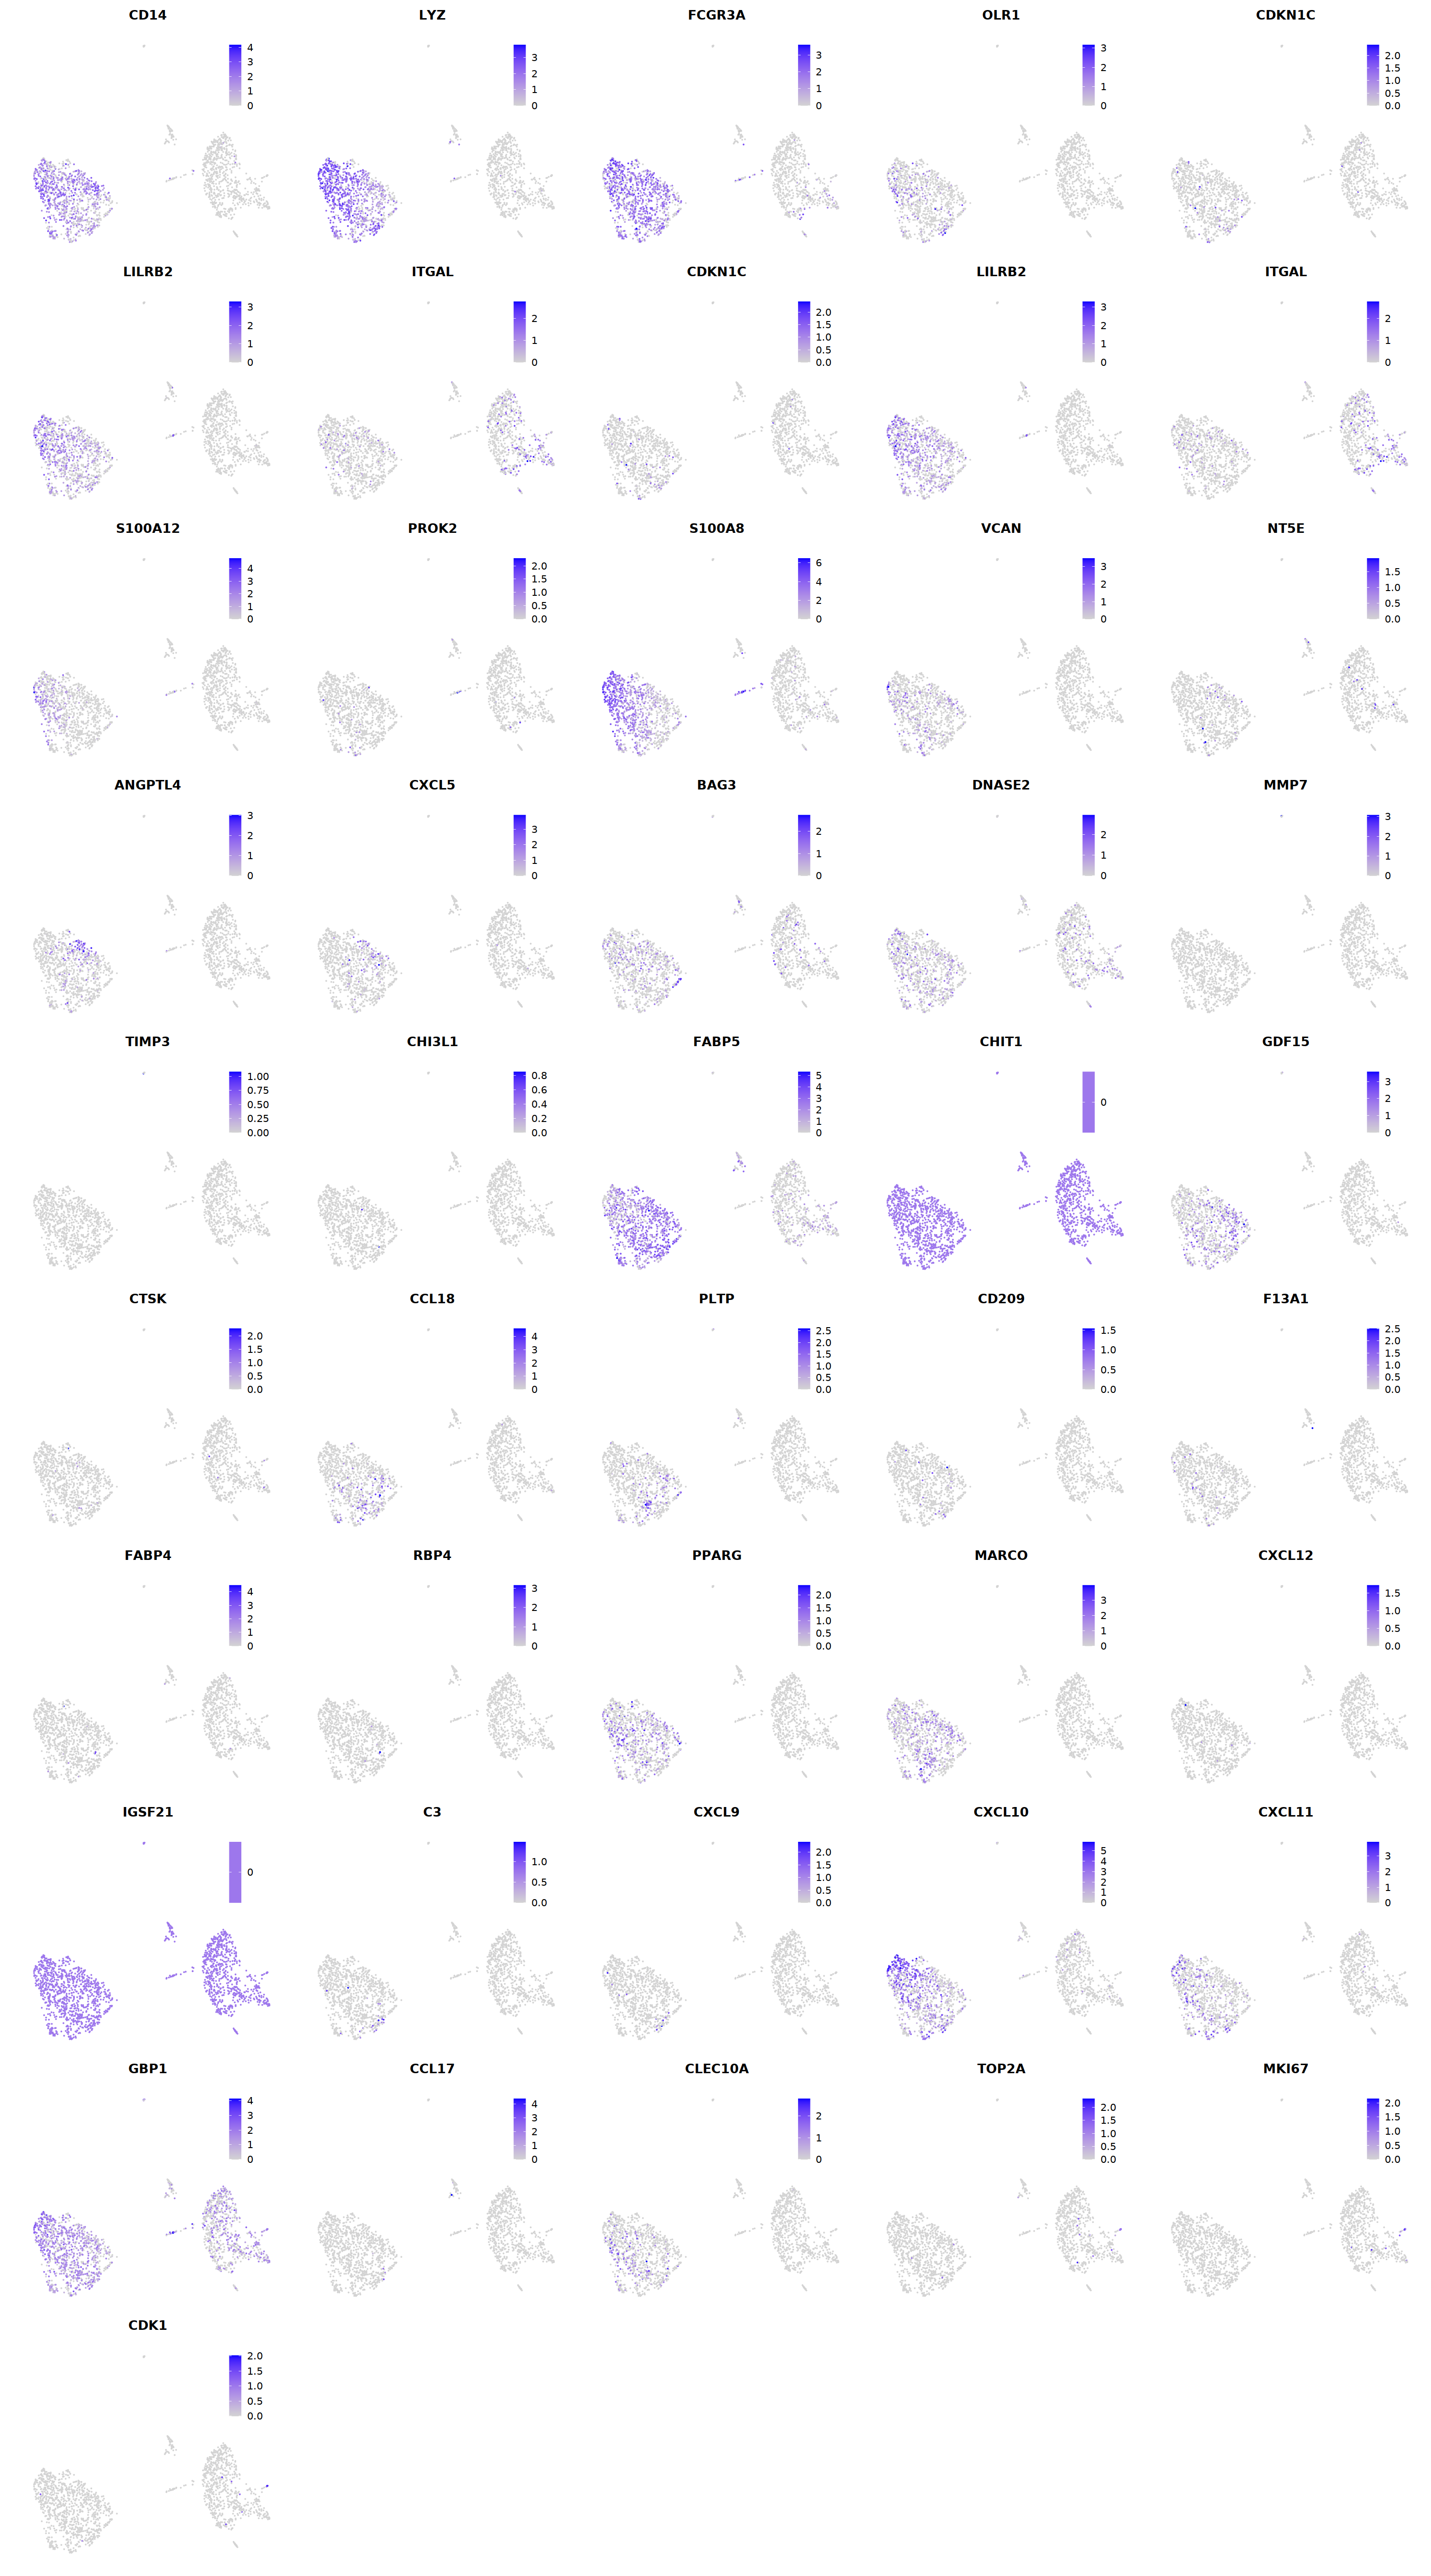
cell.sel = Cells(subset(seu, RNA_snn_res.0.9=='0'))
seu@meta.data[cell.sel, "persample_ann"] = 'macrophage'
cell.sel = Cells(subset(seu, RNA_snn_res.0.9=='2'))
seu@meta.data[cell.sel, "persample_ann"] = 'macrophage'
cell.sel = Cells(subset(seu, RNA_snn_res.0.9=='3'))
seu@meta.data[cell.sel, "persample_ann"] = 'macrophage'
cell.sel = Cells(subset(seu, RNA_snn_res.0.9=='8'))
seu@meta.data[cell.sel, "persample_ann"] = 'macrophage'
T
# T cell markers
o(5*5, 5*7)
FeaturePlot(seu, ncol = 5,pt.size=0.01,
features = c("CD3D","CD3E",'TRAC','TRBC1','TRGC2',
'TRGC1','TRDC',"CD4",'CD8A','CD8B',
'RORC','FOXP3','CD28','IL2RA',"CD44",
'CD69','CD27','PRF1','GZMK','ID2',
'RORC','GATA3','ZBTB16','IL7R','TBX21',
'NKG7','GNLY','EOMES','KLRB1','TOX',
"TOX2",'CXCR5','SELL','CD68','MT2A',
'CST7','HOPX','GZMM','KLRD1','KLRC2',
'KLRF1'), order=F)&theme(axis.line = element_blank(),
axis.title = element_blank(),axis.text = element_blank(), axis.ticks=element_blank()
)
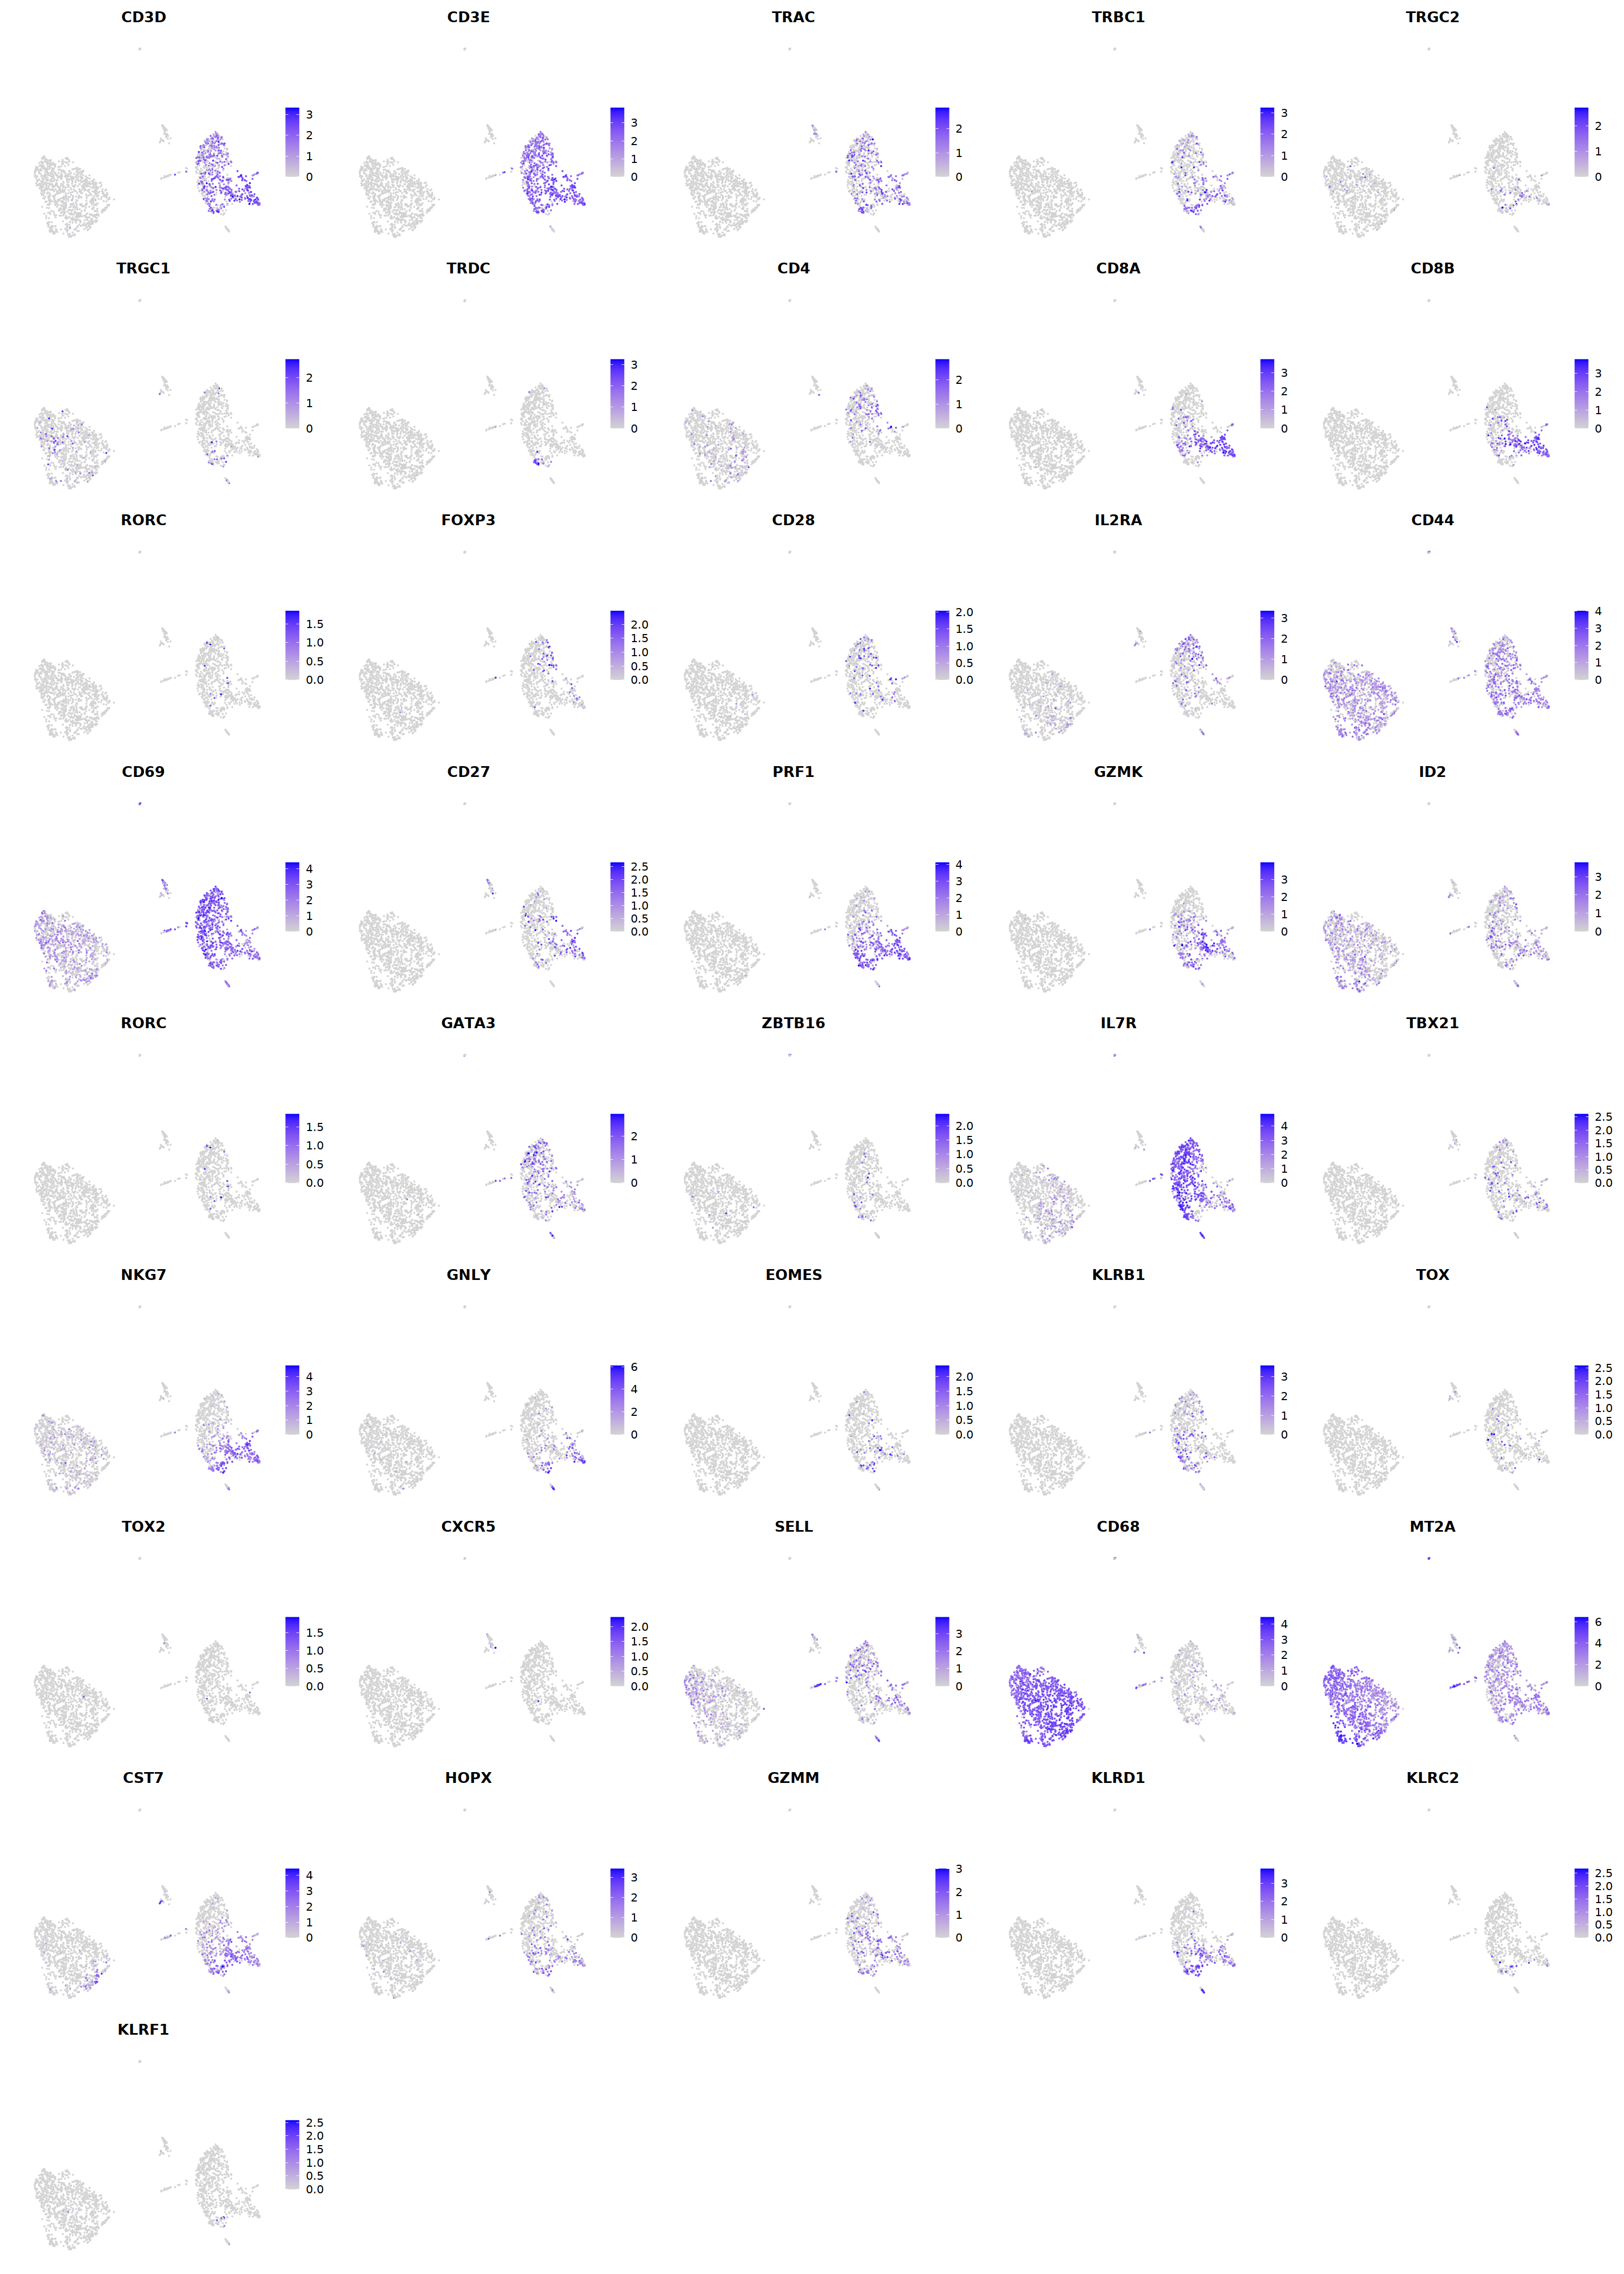
Idents(seu) <- group.by
deg = FindMarkers(seu,assay='RNA',slot='data',only.pos=T, ident.1='4_2')
deg
| p_val | avg_log2FC | pct.1 | pct.2 | p_val_adj | |
|---|---|---|---|---|---|
| <dbl> | <dbl> | <dbl> | <dbl> | <dbl> | |
| SH2D1B | 5.986470e-186 | 1.8658807 | 0.531 | 0.001 | 1.431724e-181 |
| KIR2DL4 | 3.871644e-108 | 2.6673805 | 0.594 | 0.012 | 9.259425e-104 |
| XCL1 | 2.311232e-100 | 2.6721321 | 0.562 | 0.012 | 5.527542e-96 |
| KLRC3 | 1.863274e-81 | 2.1155352 | 0.500 | 0.012 | 4.456206e-77 |
| GNLY | 6.024831e-78 | 5.2671001 | 0.906 | 0.060 | 1.440899e-73 |
| NCAM1 | 1.084144e-63 | 0.9314426 | 0.188 | 0.001 | 2.592840e-59 |
| KIR2DL3 | 3.194074e-62 | 0.8840995 | 0.156 | 0.000 | 7.638948e-58 |
| KLRD1 | 3.194807e-48 | 3.1786786 | 0.844 | 0.093 | 7.640701e-44 |
| KLRF1 | 2.374153e-46 | 1.2713025 | 0.219 | 0.003 | 5.678025e-42 |
| PDE6G | 1.812971e-43 | 0.9631850 | 0.250 | 0.006 | 4.335902e-39 |
| XCL2 | 7.199752e-43 | 2.5596437 | 0.438 | 0.023 | 1.721893e-38 |
| KLRC2 | 8.394278e-43 | 1.2678721 | 0.312 | 0.010 | 2.007576e-38 |
| KIR3DL2 | 2.158059e-29 | 0.9221975 | 0.188 | 0.005 | 5.161215e-25 |
| KLRC1 | 4.113460e-28 | 1.8726504 | 0.438 | 0.037 | 9.837751e-24 |
| GZMB | 1.714989e-27 | 2.3793873 | 0.688 | 0.098 | 4.101568e-23 |
| CD7 | 2.924975e-27 | 2.3490512 | 0.938 | 0.215 | 6.995371e-23 |
| TNFRSF18 | 1.371294e-26 | 1.4579363 | 0.406 | 0.034 | 3.279587e-22 |
| C1orf21 | 3.195872e-24 | 1.3459781 | 0.375 | 0.032 | 7.643247e-20 |
| TMIGD2 | 1.544410e-22 | 1.3030644 | 0.312 | 0.024 | 3.693612e-18 |
| PRCD | 3.064550e-22 | 0.6011054 | 0.125 | 0.003 | 7.329179e-18 |
| TRGV9 | 4.441467e-20 | 1.1263717 | 0.281 | 0.021 | 1.062221e-15 |
| SPRY1 | 2.763883e-19 | 1.2699018 | 0.312 | 0.028 | 6.610104e-15 |
| DUSP2 | 9.619282e-19 | 2.2719661 | 0.781 | 0.212 | 2.300548e-14 |
| CTSW | 5.465748e-18 | 1.6077795 | 0.594 | 0.111 | 1.307188e-13 |
| SYTL3 | 6.022462e-18 | 2.0192129 | 0.688 | 0.162 | 1.440332e-13 |
| HOPX | 1.240548e-17 | 1.8013328 | 0.531 | 0.092 | 2.966895e-13 |
| EOMES | 1.358912e-17 | 1.1013448 | 0.281 | 0.025 | 3.249973e-13 |
| FGFBP2 | 2.931011e-17 | 1.6339655 | 0.219 | 0.015 | 7.009805e-13 |
| NKG7 | 5.847903e-17 | 2.7324065 | 0.812 | 0.262 | 1.398584e-12 |
| ADGRG1 | 1.698893e-15 | 0.6031909 | 0.125 | 0.005 | 4.063071e-11 |
| ⋮ | ⋮ | ⋮ | ⋮ | ⋮ | ⋮ |
| IMP3 | 0.9486152 | 0.3546552 | 0.219 | 0.241 | 1 |
| ANXA7 | 0.9509465 | 0.3305441 | 0.250 | 0.301 | 1 |
| RAB9A | 0.9511792 | 0.2934201 | 0.281 | 0.318 | 1 |
| PARP10 | 0.9518298 | 0.3222678 | 0.406 | 0.490 | 1 |
| PIK3R5 | 0.9522779 | 0.2651083 | 0.250 | 0.307 | 1 |
| CARD19 | 0.9539968 | 0.2957695 | 0.250 | 0.295 | 1 |
| SLC35B1 | 0.9564482 | 0.2531231 | 0.188 | 0.211 | 1 |
| PIGP | 0.9570754 | 0.3902856 | 0.094 | 0.105 | 1 |
| DPM2 | 0.9620636 | 0.2631352 | 0.156 | 0.171 | 1 |
| B3GAT3 | 0.9648746 | 0.2514349 | 0.219 | 0.246 | 1 |
| ALKBH5 | 0.9654700 | 0.2659148 | 0.094 | 0.105 | 1 |
| UBAP2L | 0.9660665 | 0.4184927 | 0.156 | 0.172 | 1 |
| FURIN | 0.9662471 | 0.3994506 | 0.219 | 0.255 | 1 |
| PPP1R7 | 0.9666439 | 0.2941523 | 0.188 | 0.211 | 1 |
| DAP3 | 0.9687781 | 0.2536556 | 0.219 | 0.248 | 1 |
| ALOX5AP | 0.9700731 | 0.5545246 | 0.469 | 0.542 | 1 |
| CHCHD1 | 0.9722073 | 0.5685780 | 0.188 | 0.219 | 1 |
| EBPL | 0.9766131 | 0.2815181 | 0.125 | 0.133 | 1 |
| SH3GL1 | 0.9784936 | 0.3108603 | 0.125 | 0.141 | 1 |
| RNF4 | 0.9808826 | 0.3346271 | 0.125 | 0.135 | 1 |
| ATP2A3 | 0.9810309 | 0.3402109 | 0.156 | 0.167 | 1 |
| PSTPIP1 | 0.9812432 | 0.2907558 | 0.125 | 0.133 | 1 |
| RAD21 | 0.9828492 | 0.2918706 | 0.250 | 0.286 | 1 |
| STAT6 | 0.9830588 | 0.4617170 | 0.281 | 0.335 | 1 |
| VEZF1 | 0.9832446 | 0.2789508 | 0.125 | 0.136 | 1 |
| FBXL15 | 0.9886219 | 0.2954153 | 0.156 | 0.175 | 1 |
| TMEM126B | 0.9918570 | 0.3537746 | 0.156 | 0.171 | 1 |
| UBXN4 | 0.9945728 | 0.3020680 | 0.375 | 0.440 | 1 |
| DERL1 | 0.9967476 | 0.5455145 | 0.250 | 0.288 | 1 |
| COPZ1 | 0.9979047 | 0.2755184 | 0.281 | 0.347 | 1 |
cell.sel = Cells(subset(seu, RNA_snn_res.0.9=='1'))
seu@meta.data[cell.sel, "persample_ann"] = 'T CD4'
cell.sel = Cells(subset(seu, RNA_snn_res.0.9=='6_2'))
seu@meta.data[cell.sel, "persample_ann"] = 'T cycling'
cell.sel = Cells(subset(seu, RNA_snn_res.0.9=='4_1'))
seu@meta.data[cell.sel, "persample_ann"] = 'gdT'
cell.sel = Cells(subset(seu, RNA_snn_res.0.9=='4_2'))
seu@meta.data[cell.sel, "persample_ann"] = 'NK'
cell.sel = Cells(subset(seu, RNA_snn_res.0.9=='4_0'))
seu@meta.data[cell.sel, "persample_ann"] = 'T CD8'
cell.sel = Cells(subset(seu, RNA_snn_res.0.9=='5'))
seu@meta.data[cell.sel, "persample_ann"] = 'T CD8'
cell.sel = Cells(subset(seu, RNA_snn_res.0.9=='6_0'))
seu@meta.data[cell.sel, "persample_ann"] = 'T CD8'
cell.sel = Cells(subset(seu, RNA_snn_res.0.9=='6_1'))
seu@meta.data[cell.sel, "persample_ann"] = 'T CD8'
o(8,7);DimPlot(seu, group.by='persample_ann', label=T, repel=T, pt.size=0.1)
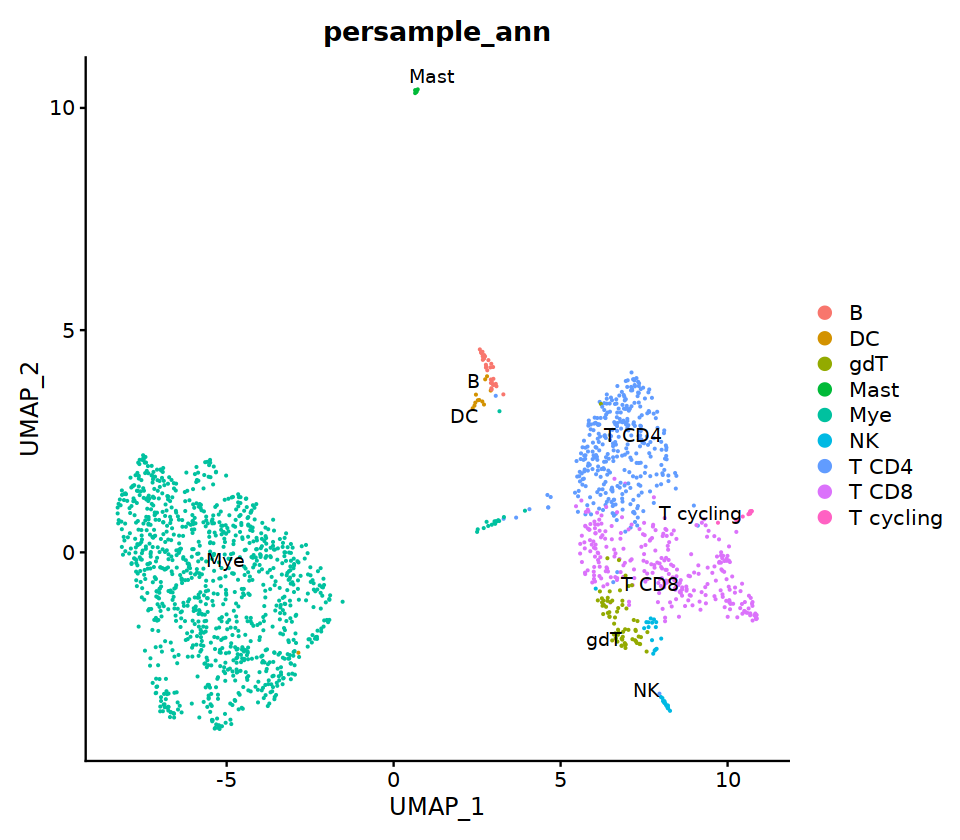
S6
# context switching
sample_name='S6'
seu= immune.list[[sample_name]]
group.by= 'RNA_snn_res.0.9'
o(17,8)
ggarrange(
DimPlot(seu, group.by=group.by, label=T,repel=T, label.size = 5, cols=manymanycolors),
DimPlot(seu, group.by='integrated_ann', label=T,repel=T, label.size = 5),
nrow=1, ncol=2
)
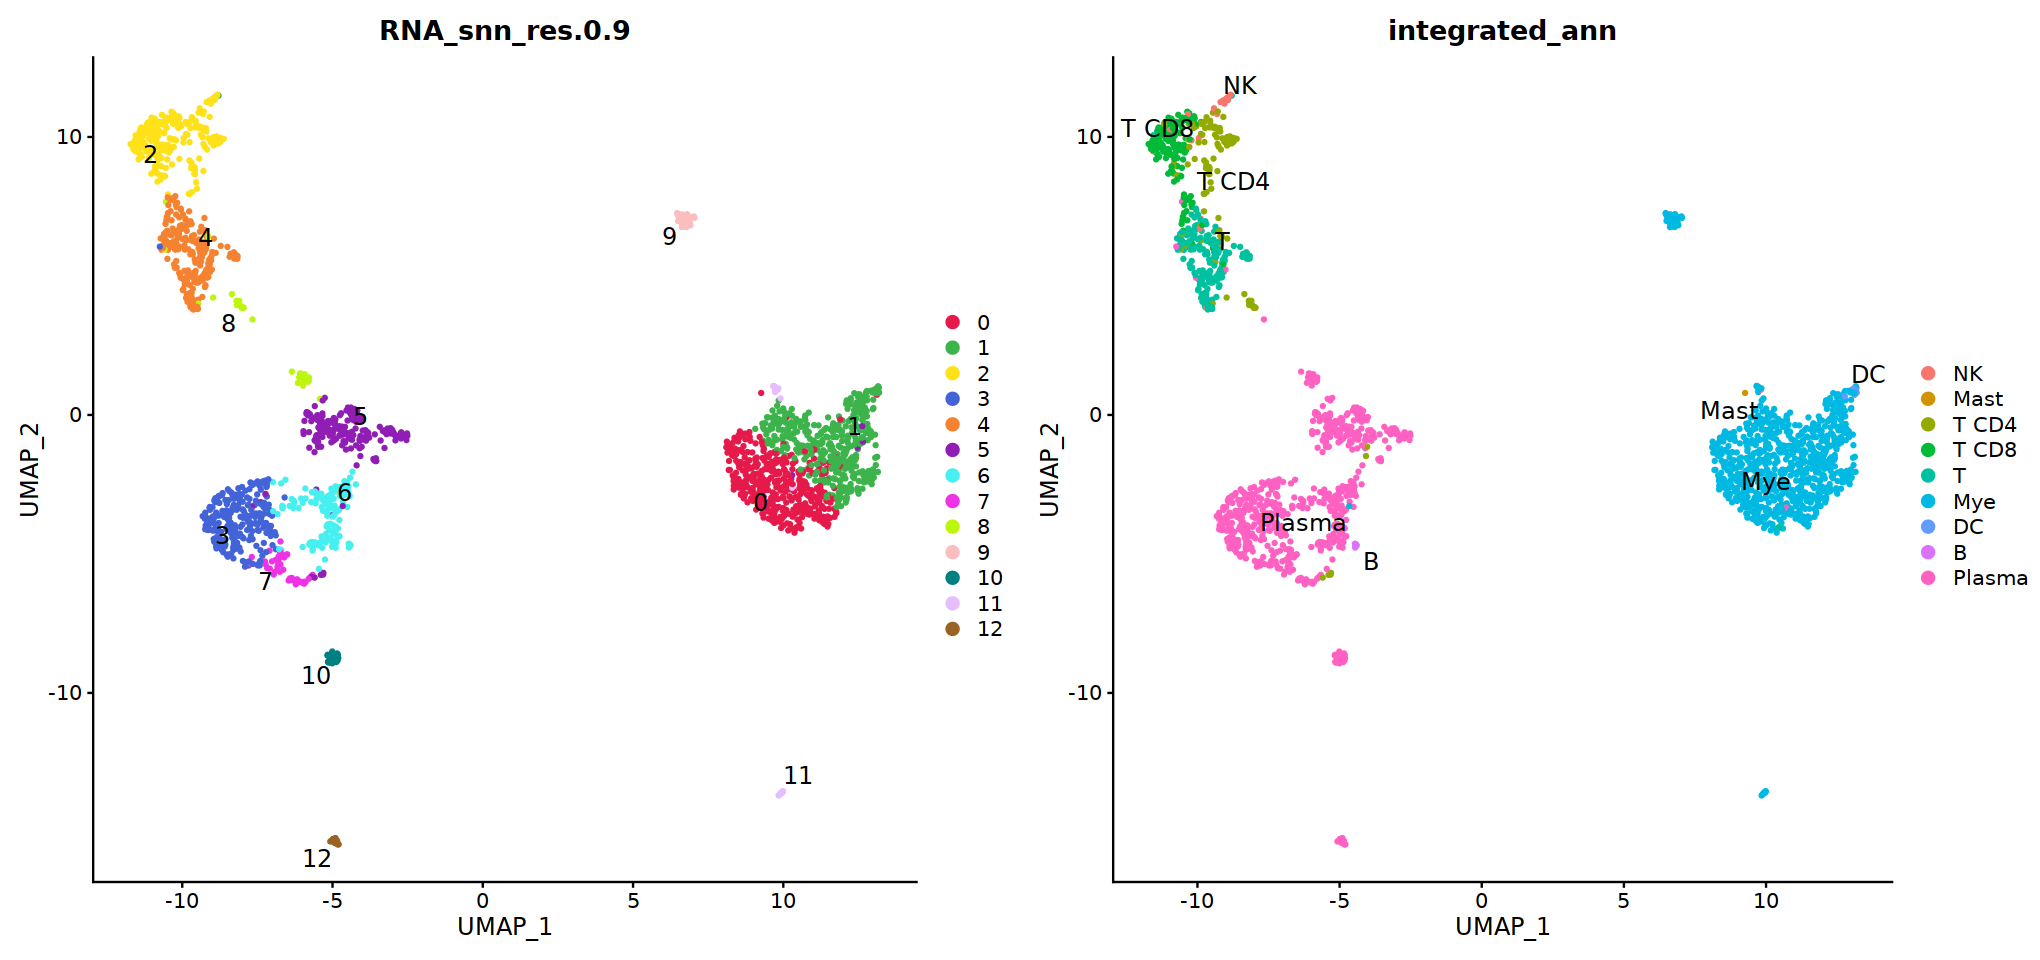
# adopt integrated_ann first
seu@meta.data[, "persample_ann"] = as.character(seu@meta.data[, "integrated_ann"] )
DC
# pDC
p=Nebulosa::plot_density(seu,c('IRF4','LILRA4','LILRB4','IRF8'),joint=T)&theme(
axis.title=element_blank(),axis.ticks=element_blank(),axis.text = element_blank())&NoLegend()
o(5*6, 5*1)
p+plot_layout(ncol = 6)
# cDC1
p=Nebulosa::plot_density(seu,c('HLA-DQA1','BATF3','CADM1','CLEC9A','XCR1'),joint=T)&theme(
axis.title=element_blank(),axis.ticks=element_blank(),axis.text = element_blank())&NoLegend()
o(5*6, 5*1)
p+plot_layout(ncol = 6)
# cDC2
p=Nebulosa::plot_density(seu,c('CD14','PLD4','CD1C','CX3CR1','CLEC10A'),joint=T)&theme(
axis.title=element_blank(),axis.ticks=element_blank(),axis.text = element_blank())&NoLegend()
o(5*6, 5*1)
p+plot_layout(ncol = 6)


Mac
# macrophages
o(5*5, 5*9)
FeaturePlot(seu, ncol = 5, pt.size=0.01,
features = c("CD14",'LYZ',"FCGR3A",
'OLR1','CDKN1C','LILRB2',"ITGAL",
'CDKN1C','LILRB2','ITGAL',
'S100A12','PROK2','S100A8','VCAN',
'NT5E','ANGPTL4','CXCL5','BAG3',
'DNASE2',
'MMP7','TIMP3','CHI3L1','FABP5',
'CHIT1','GDF15','CTSK',
'CCL18','PLTP','CD209','F13A1',
'FABP4','RBP4','PPARG','MARCO',
'CXCL12','IGSF21','C3',
'CXCL9','CXCL10','CXCL11','GBP1',
'CCL17',"CLEC10A",
"TOP2A","MKI67",'CDK1')
)&theme(
legend.position=c(0.8,0.8),
axis.line = element_blank(),
axis.title = element_blank(),axis.text = element_blank(), axis.ticks=element_blank()
)
Warning message in FeaturePlot(seu, ncol = 5, pt.size = 0.01, features = c("CD14", :
“All cells have the same value (0) of CXCL12.”
Warning message in FeaturePlot(seu, ncol = 5, pt.size = 0.01, features = c("CD14", :
“All cells have the same value (0) of CCL17.”
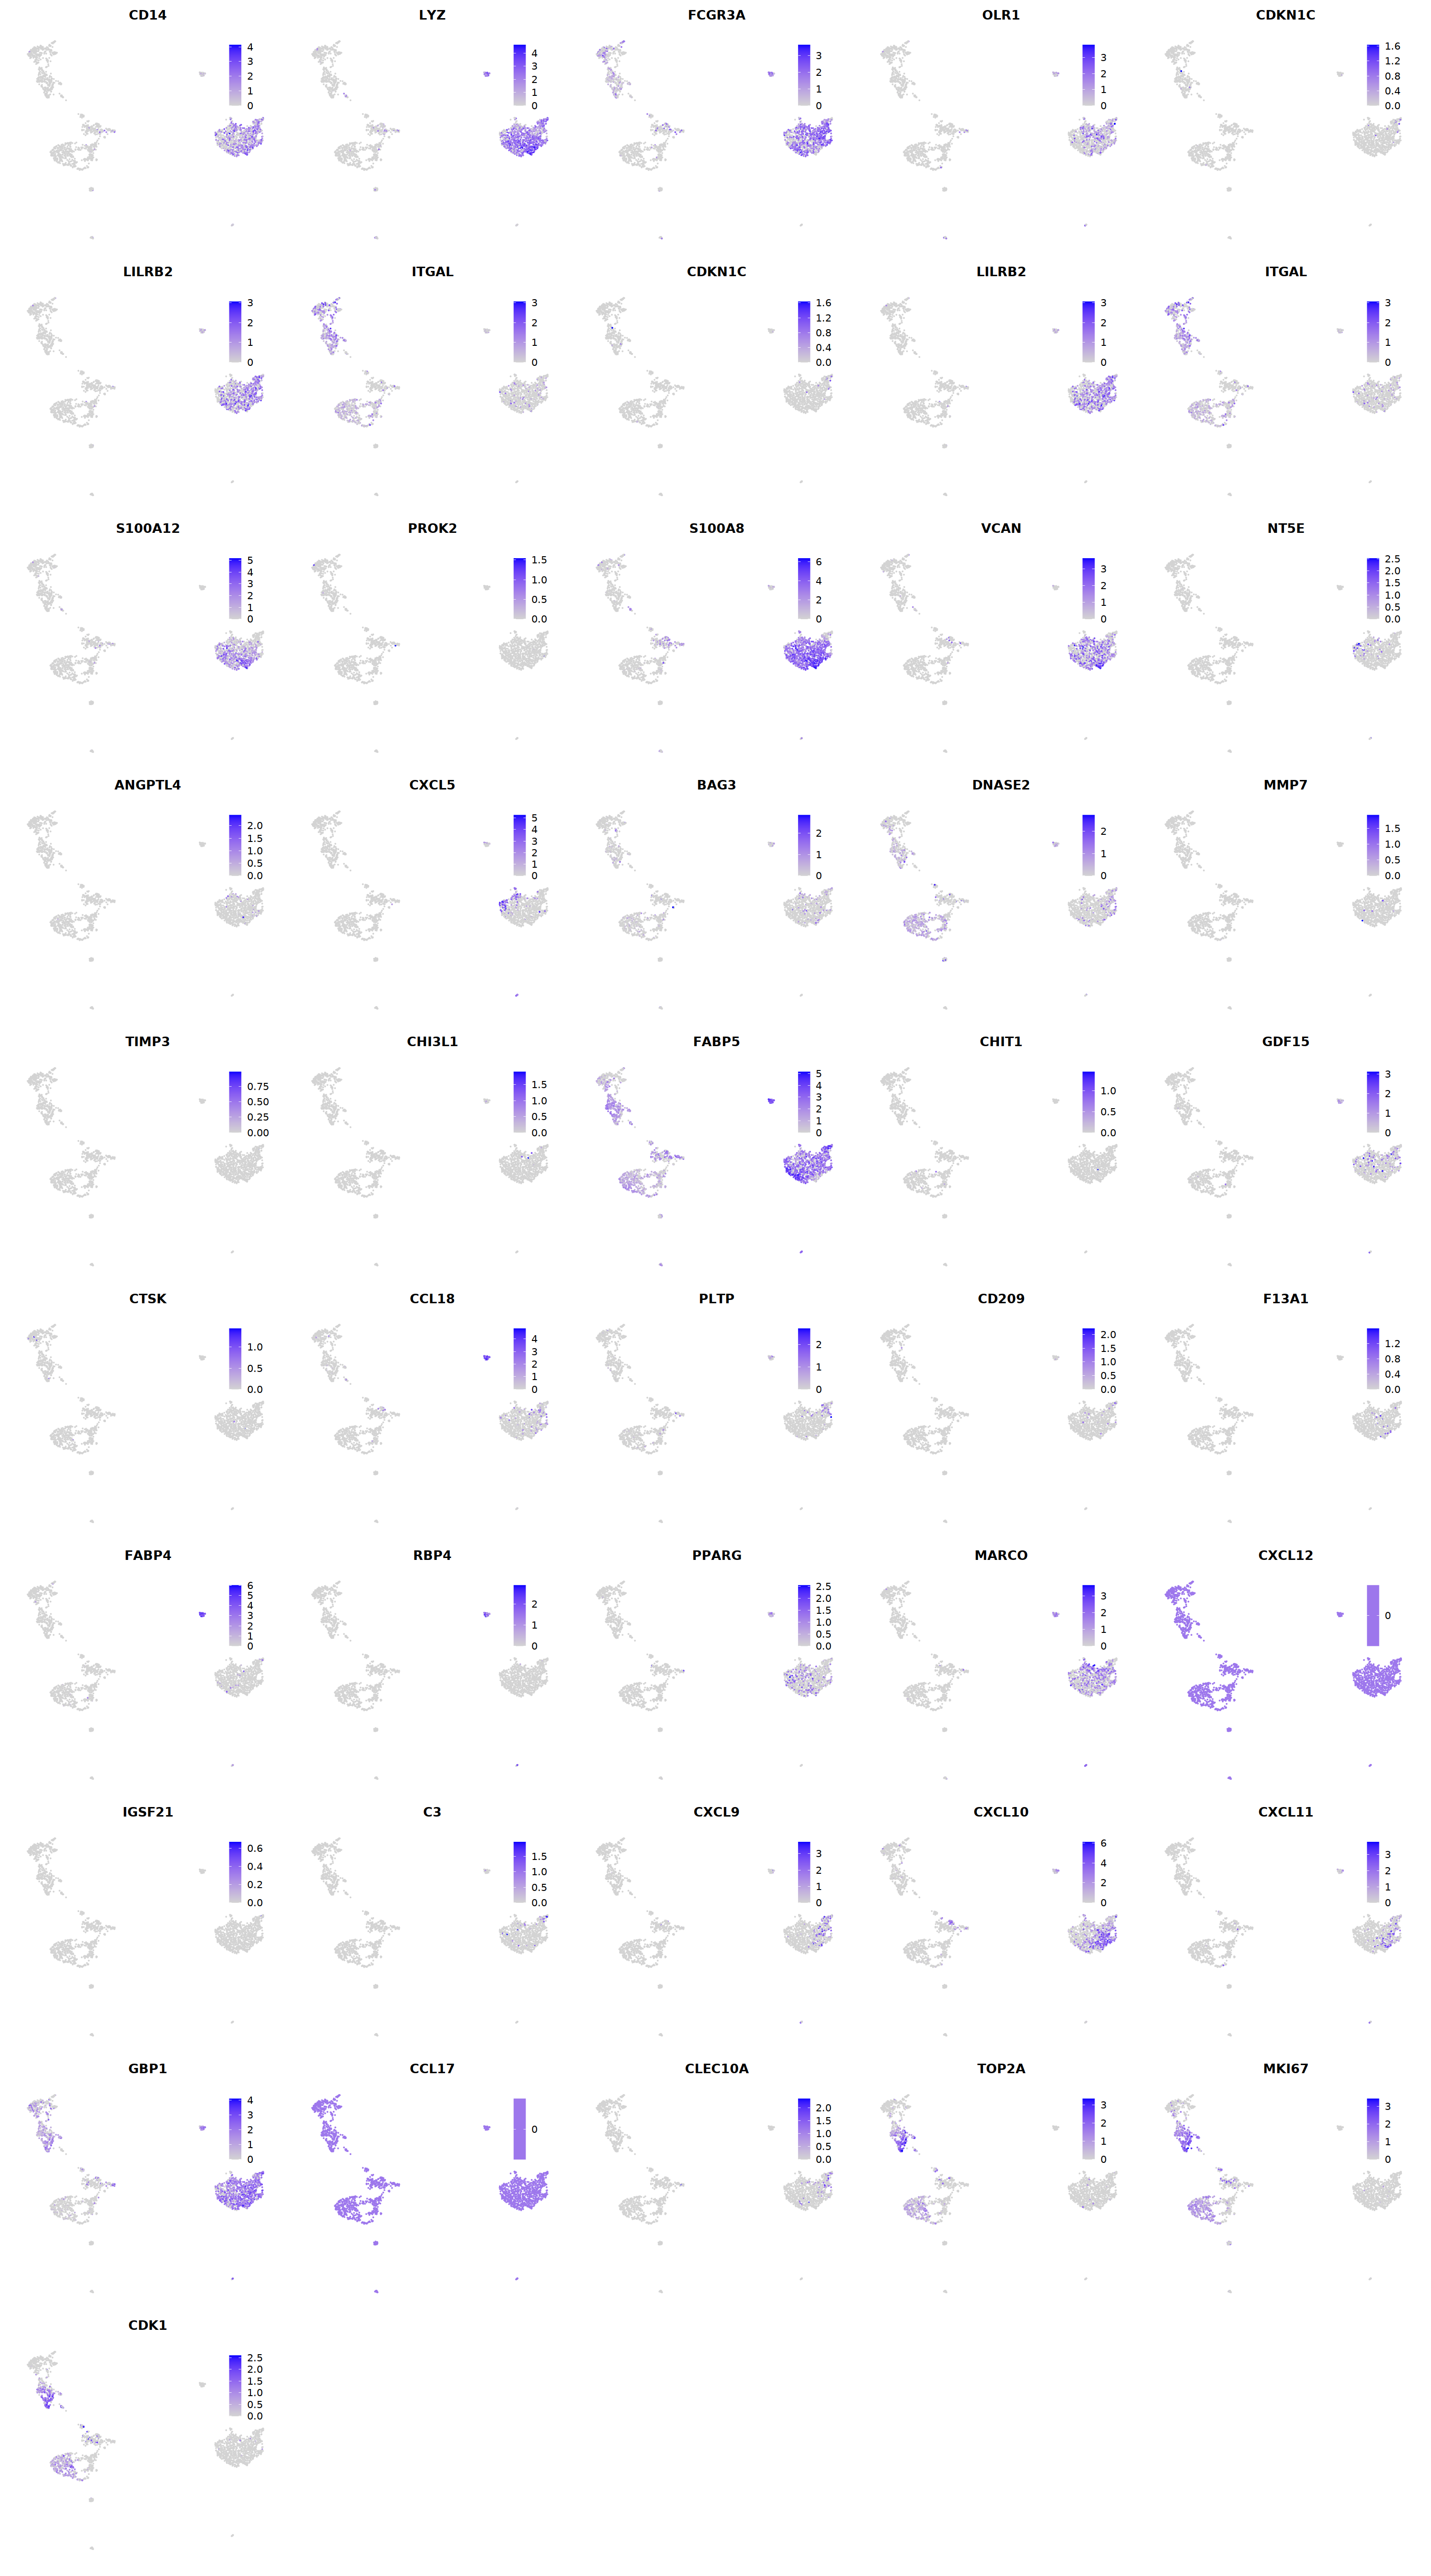
T
# T cell markers
o(5*5, 5*7)
FeaturePlot(seu, ncol = 5,pt.size=0.01,
features = c("CD3D","CD3E",'TRAC','TRBC1','TRGC2',
'TRGC1','TRDC',"CD4",'CD8A','CD8B',
'RORC','FOXP3','CD28','IL2RA',"CD44",
'CD69','CD27','PRF1','GZMK','ID2',
'RORC','GATA3','ZBTB16','IL7R','TBX21',
'NKG7','GNLY','EOMES','KLRB1','TOX',
"TOX2",'CXCR5','SELL','CD68','MT2A',
'CST7','HOPX','GZMM','KLRD1','KLRC2',
'KLRF1'), order=F)&theme(axis.line = element_blank(),
axis.title = element_blank(),axis.text = element_blank(), axis.ticks=element_blank()
)
